 data_cities
See also: data_maps
If you visualize spatial data, it is often necessary to display them in relation to the real space. Therefore, we use some basic datasets, such as the World Map or database of World Cities. For this purpose, the Stagraph directly (in GUI) supports R package named maps. This package provides several datasets of spatial data. We can divide them into polygonal datasets of counties, states, regional entities and point datasets showing cities.
In this section, we’ll talk about point datasets of cities. Usage options of spatial datasets are displayed in the following tutorial.
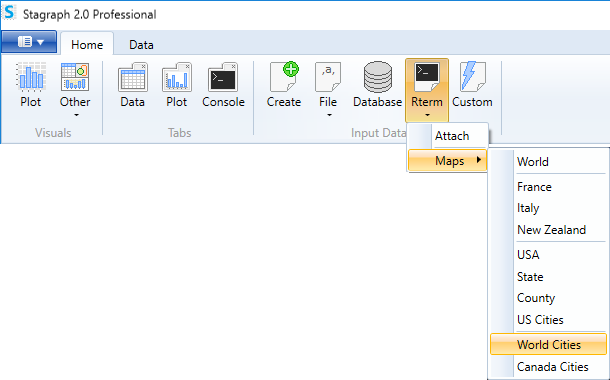
Overall, Stagraph uses three datasets - data_us_cities, data_world_cities and data_canada_cities. You can import them into Stagraph by clicking on the Rterm button in the ribbon toolbar and selecting the desired dataset from displayed menu - US Cities, World Cities and Canada Cities:
| data_us_cities |
us cities with population greater than about 40,000 |
| data_world_cities |
world cities with population greater than about 40,000 |
| data_canada_cities |
canadian cities with population greater than about 1,000. Also included are province capitals of any population size |
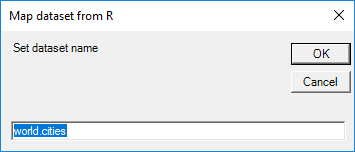
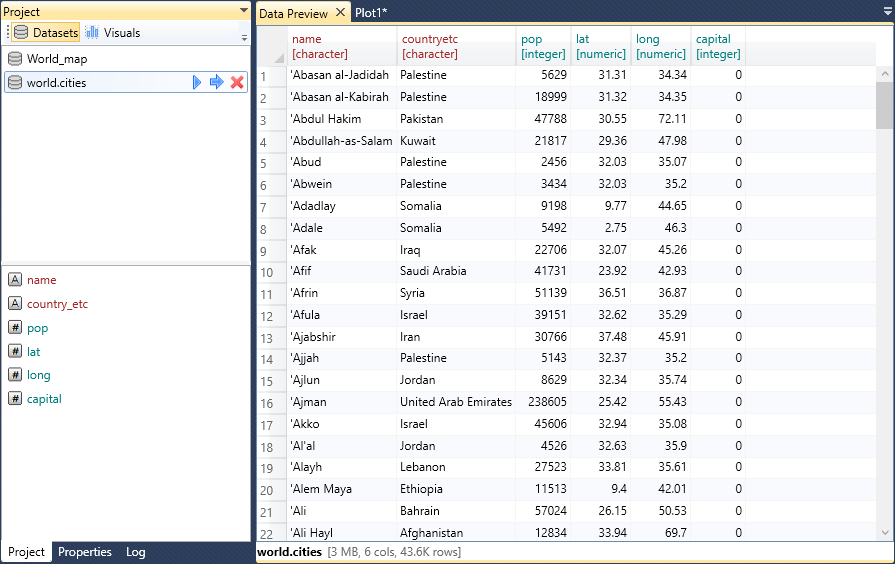
When you click on the selected item, the Input Box appears, where you type the dataset name. After clicking the OK button, the dataset (with typed name) will be listed in the Project Panel.
After the import, you can work with the dataset. All "cities" datasets have the same structure of variables - city name, country name, population, lat & long coordinates and boolean variable indicating the capital city.
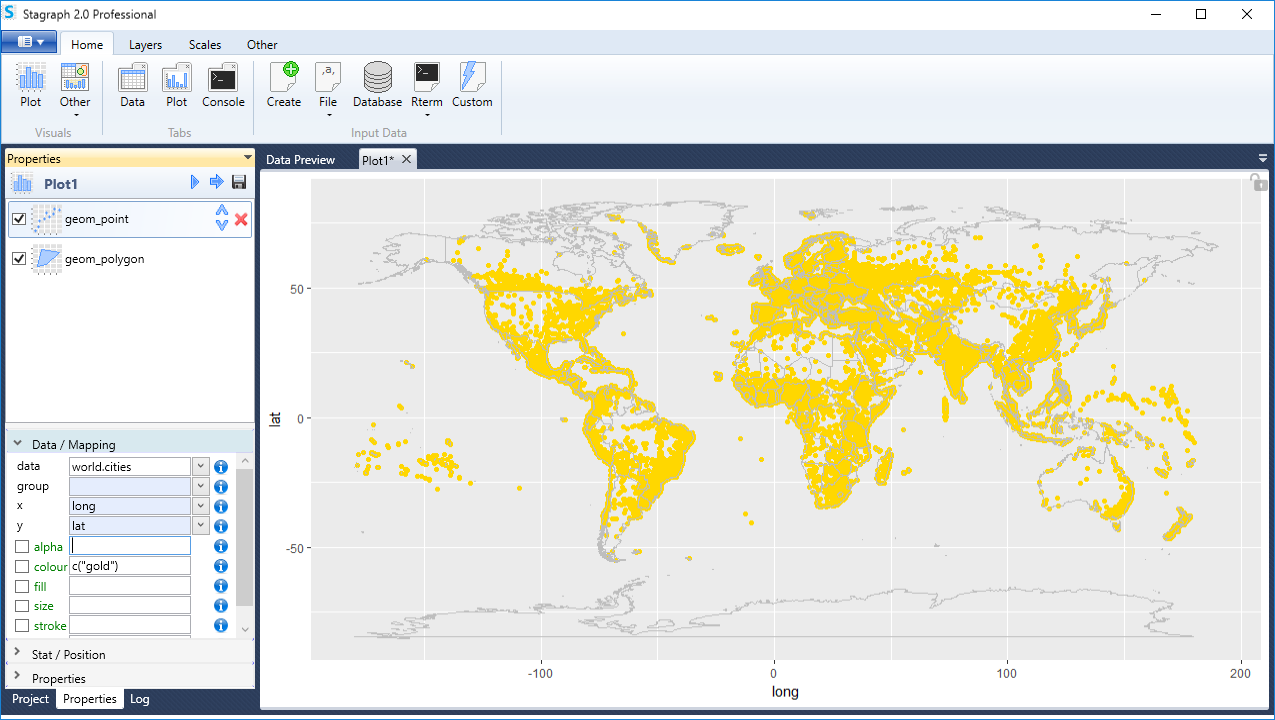
Created dataset can be immediately used in your visualizations. The following image shows all cities that are included in the data_world_cities dataset.
In addition to the datasets listed in this section, the maps package includes also other datasets that are not directly accessible from the Stagraph. You can find their list together with description here. Unsupported maps datasets you can use through the data_custom function.