Stagraph User Interface
Well designed visual user interface can significantly help you at work. My goal was to create
a responsive desktop interface that makes it easy, fast and efficient to take individual steps
in your data analysis. Stagraph interface is built on the top of R language. This means that your individual steps in the
interface are automatically converted into scripts in the R language. These scripts are sent to R
runtime that is running in the background. The results of your processing steps are automatically presented back in the interface. The advantage
of this architecture is that the interface does not "freeze" during time-consuming steps. The user
interface is briefly presented in the following video. In detail is discussed in the following text.
Interface Components
Main Menu
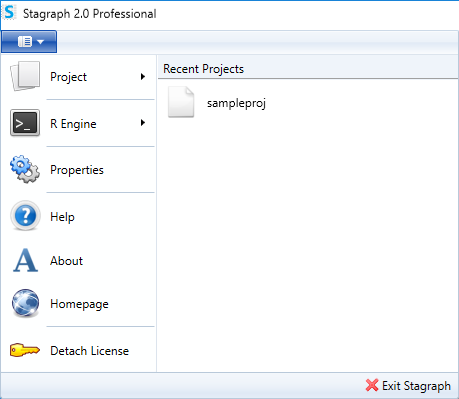
The basic functions for Stagraph can be found under the ribbon main menu button. In the right part
of the panel is a list of recently used projects. Other main menu functions are on the left side. Here
can be found functions for displaying the online documentation, program info and project homepage. At the
end, you can find features for Professional edition activation / deactivation. If you want to use the
Professional version, you must activate your license using the Attach License command. For license
detaching, click on the Detach License command.
Feature for managing your projects are under the first - Project menu item. In the drop-down menu you
can find the functions for project saving or opening. With the function Export as R Script you can
completely export your project as a clean script in R language (in the Professional edition). Just click on
the menu item and your current project will be automatically exported.
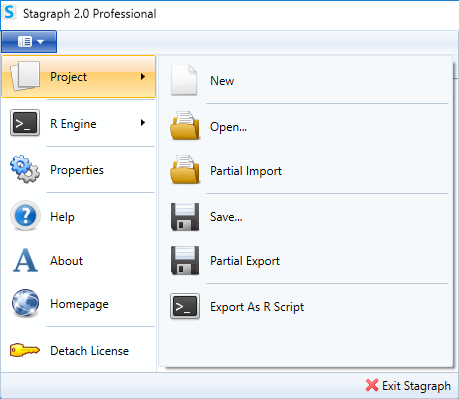
In addition to these functions, you can find two specific menu items - Partial Import and Partial
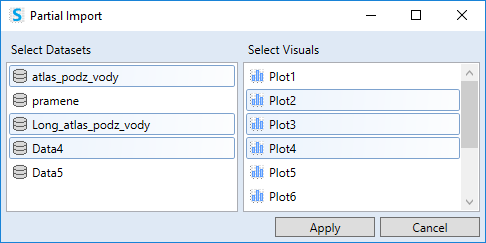
Export. These features serves to increase the efficiency of your work. Imagine that you are working on a
new project for which you need to use datasets (or data visualizations) that you have prepared in the past
but are stored in other project files. If would be good to select them from an existing project and insert
into the current one. Exactly, for this purpose serves the Partial Import function. After the old
project selection a special dialog appears, where you can select required datasets and visualizations that
you can import. Using the Apply button, selected objects will be added from the old project into the
current.
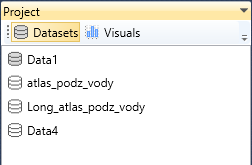
To the current project are these objects imported in the form of a definition. In the case of datasets, you
will see their icons in the Project Panel displayed without the fill - datasets are defined in project, but
were not executed in the background-running R terminal. If you want to use them, you need to execute them -
send to the R terminal. This procedure was chosen to save the memory space. You can execute them in the time
you really need them.
Similarly, the Partial Export function serves to export only selected datasets and data visualizations
from the current project (to a separate project file on the disk).
Under the second menu item (R Engine) you will find functions for R runtime controlling. Using the
first menu item - R Console it is possible to display the built-in R console. This console controls
the R terminal that runs behind the Stagraph. The second command - Restart R is ready to restart the
background R terminal, in the case it will freeze. After the restart, you will lose all the data from computer
memory that you have imported (datasets and data visualizations). Therefore, it is necessary to execute them
again.
The function Install Required R Packages serves to runtime preparation for its full use. For example,
if you are using an externally installed R, you must have to installed all the necessary R packages. Clicking
on this menu item, you can install all packages automatically in a parallel (independent) process. After
finish, the parallel process is automatically terminated. In addition to automatic execution, you can also
copy the installation script (in R language) into your clipboard and execute it manually later.
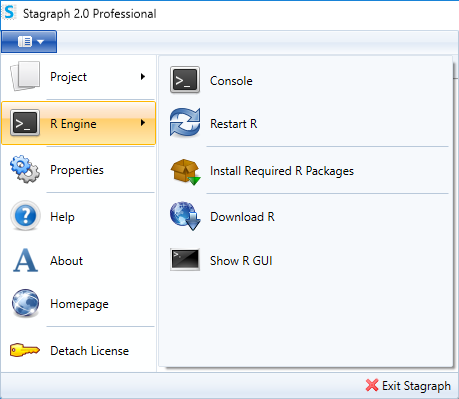
With the next command Download R you can display the
r-project.org website, where you can download latest R installation. Finally, using the Show R GUI
command, you can run the Rgui.exe program as a separate process.
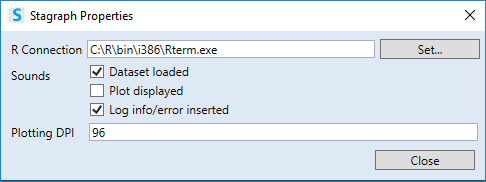
Another important Stagraph feature is located under the Properties menu item. This item displays the
Stagraph Properties dialog, where you can set some basic application properties. In this dialog you
can define the connection between the Stagraph and the R runtime (R Connection). Using the Sounds
check-boxes you can turn on / off predefined sounds that are played when the dataset is successfully
loaded into the memory, when the data visualization is completed or when an error / warning has been logged
in the R terminal. Using the last property Plotting DPI, it is possible to define the resolution at
which your data visualizations in Stagraph will be rendered.
DPI resolution for your data visualizations can be defined also when you export them
from the Stagraph. This functionality is described in a separate chapter later.
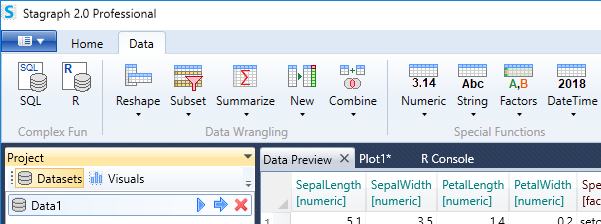
Ribbon Toolbar
Another important part of the program interface is the toolbar. Ribbon toolbar is responsive in the Stagraph.
At any moment you can see only functions that you can immediately use.
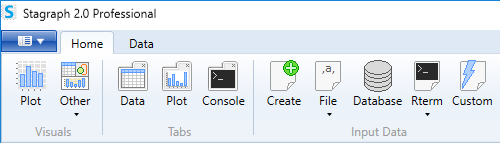
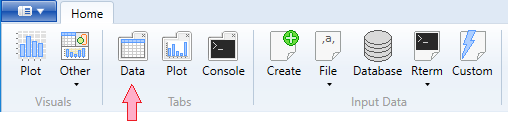
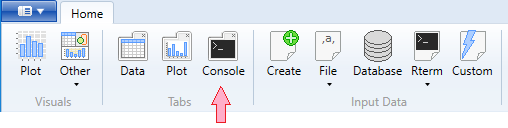
The features that are displayed on the Home toolbar tab are essential and they are divided into three
groups - Visuals, Tabs and Input Data. Using the functions in the Visuals group,
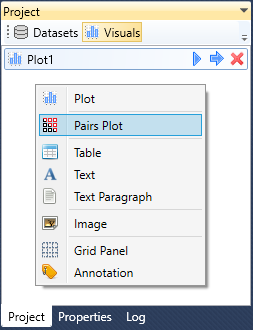
you can add new visual objects to your current project. Primary visual object in application is the Plot.
Using the Plot object you can create two-dimensional charts. Other objects are under the Other button.
These objects are used to drawing Pairs Plots, data visualization Annotations, Images,
Tables and Text Paragraphs. With the Grid Panel, you can create visualizations composed
from several plots, images and tables. These objects are documented in separate chapters.
Buttons from the Tabs group displays three types of windows in the Document Area - Data Preview,
Plot and R Console. Data Preview Document displays a preview of imported and pre-processed
data that you have in your computer memory. Plot Document displays created data visualizations. R
Console displays an IDE for direct work with the background running R terminal.
The functions in the Input Data group are used to import data from various sources such as files,
databases and embedded (sample) data from R terminal. With the Custom button, you can import data from
other sources through R scripts such as other file types or web services. Finally, the Create button
displays an built-in spreadsheet where you can enter your data manually. Individually will be these functions
described in separate documentation chapters.
If you need more space in the Stagraph window for your data visualizations, you can hide the ribbon toolbar.
If you double-click on any ribbon tab title, all buttons will be hidden and you can view them again after
click on selected tab.
The second option how to increase the space for your data visualizations is to select
the Plot Document and drag it outside the main window. Then you can resize the document to desired area.
In addition, at the data visualization export, you can precisely define its size and resolution.
The Home ribbon toolbar tab is in application displayed always. Other tabs are visible depending on your
activity. Their visibility depends on the object type that is selected in the Project Panel. If you click on
some dataset, the ribbon tab Data will appear. Using the features on this tab, you can edit, clean,
wrangle and combine your datasets. About the data wrangling in Stagraph is one extensive chapter. Data wrangling
functions significantly expands the functionality of the Stagraph and are without restrictions fully accessible
also in the Free edition.
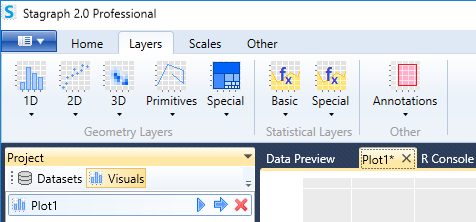
If you choose in the Project Panel an Plot object, three new ribbon toolbar tabs will appears, namely Layers
, Scales and Other. Using the functions from these three tabs, it is possible to create very impressive
data visualizations. If you choose another object type (in the Project Panel) from the Visuals group, these
tabs will be hidden because they are related only with the Plot objects. Settings of other Visuals can be defined
via the Properties Panel.
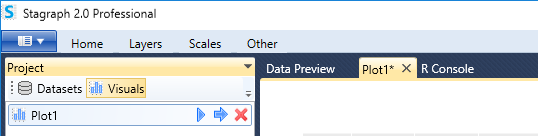
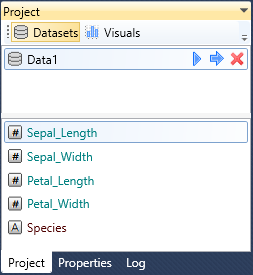
Project Panel
The Project Panel is significant part of the program. This panel displays all the datasets and visual objects
you have created in the current project. Datasets are displayed when you click on the Datasets button in the
panel toolbar.
If you select some dataset from the list, three buttons will displays on the right side. By the first button you can
send defined dataset for processing to the R terminal. The middle button serves for the same purpose with the
difference that in the Data Preview Document will be a small part of the dataset displayed as a preview.
Finally, using the last button you can remove your dataset from the project (also from the background R terminal).
If the dataset was sent for processing to the R terminal and the process was error-free, individual dataset variables
with their data type (e.g. character, factor, date, numeric, …) are listed in the bottom part of the Project Panel.
The data type of variable is presented in the list by an icon, font color and it is also displayed in the
variable tooltip.
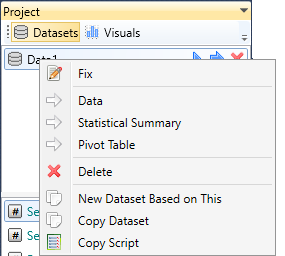
Other features are hidden in the contextual menu (right-click on the selected dataset). These functions will be
described in a separate chapter.
If you click on the Visuals button in the Project Panel toolbar, a list of created visual objects will be
displayed. You can add them to the project via the ribbon toolbar or using the context-menu when you right-click
on a blank space in the Project Panel. As in the case of datasets, if you select one object in the list, three
buttons becomes visible on the right side. By these buttons you can send selected object to the R terminal for
processing or you can remove it from your project.
Properties Panel
In the Project Panel, you can choose the object you want to work with - a dataset or an object from the Visuals
group. After the object selection (in the Project Panel), its definition is displayed in the Properties
Panel.
Updated Properties Panel will appear automatically, if you double-click on the selected
object in the Project Panel.
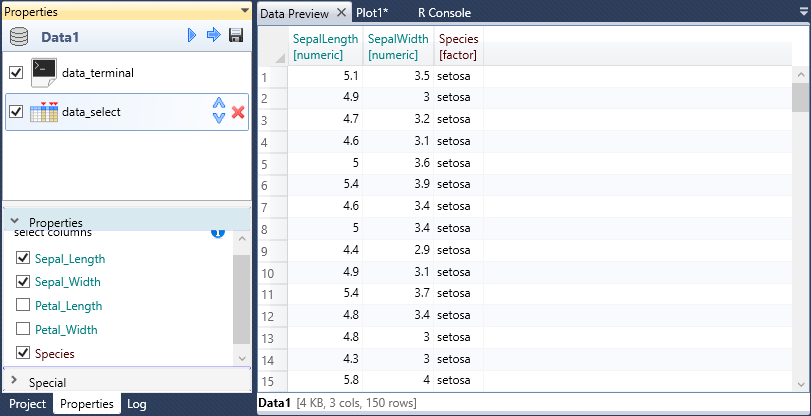
In the following examples, the Properties Panel is shown after the Dataset, Plot and Pairs Plot selection.
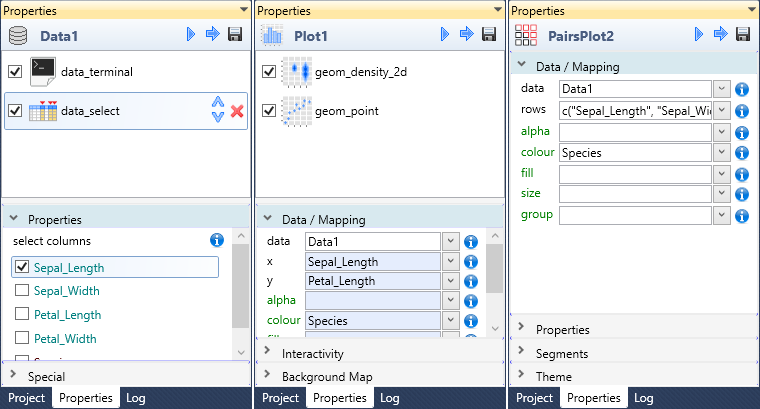
As can be seen, the content of the Properties Panel is reactive and its character is dependent on the selected
object in the Project Panel. At the top, the name of the object is displayed together with an icon that
represent the object type. Subsequently - similar to the Project Panel, there are three buttons of the
same character. Using the first button you will send your object to the R terminal. If you click on the second
button, the same process is carried out, but the result is displayed in the Document Area (data visualization or
dataset preview).
The last button is used for export. If a dataset is displayed in the Properties Panel, as result is (from the R
terminal) a simple CSV file exported. If you work with an object from the Visuals group, you can export your
data visualization in multiple formats (raster or vector).
Below the object name, you can find individual properties that you can set. If a Dataset or Plot object is loaded,
a list of functions is displayed. Clicking on these functions you can display their properties (arguments) at the
bottom of the panel. These functions are applied to the selected Dataset or Plot. On the previous example (Dataset
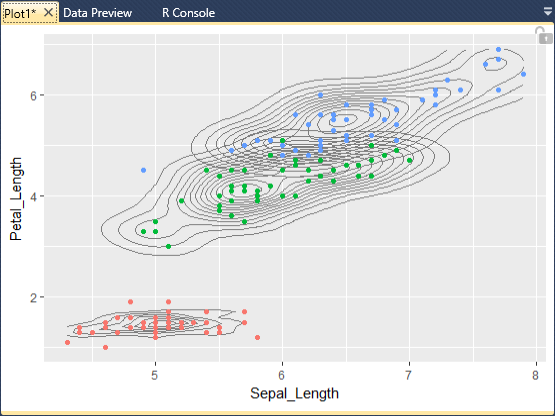
properties), you can see the dataset is defined as build-in sampe dataset (iris) from R terminal. In the second
step is used data_select function that allows you to select only required dataset variables. In the case
of Plot object, there are used two functions (geom_point and geom_density_2d) that inserts two
geometric layers - points and density contour lines.
The detailed functionality of the Properties Panel will be explained in detail in several chapters.
Log Panel
In the Stagraph, you define the data import / wrangling / cleaning / combining / visualization in a visual mode.
The program gives you a lot of options and tries not to limit you. Prepared datasets and data visualizations are
sent to the R terminal as R scripts. After the execution, results are displayed back in the main window. Basic
control is already done in the Stagraph. But most of the errors are identified in the R terminal, during the
execution. If an error occurred on this level, user is informed about it by the sound and the error message is
recorded in the Log Panel.
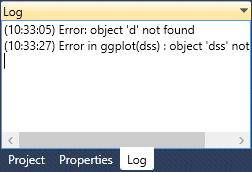
Log Panel is a simple text-box control that displays error messages and other R terminal alerts. According to
these messages, it is possible to identify the source of errors and edit it in the Properties Panel.
Plot Document
Plot Document is a GUI control in the Document Area in which are rendered your data visualizations
from the R runtime. These outputs are charts, tables, pictures, text paragraphs and their combinations.
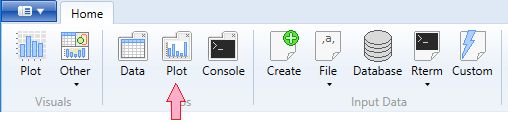
The Plot Document you can display by clicking on the Plot button in the ribbon toolbar.
Your data visualizations are displayed in the form of raster images. Noninteractive - raster form was
selected due to speed and efficiency (e.g. complex geometries or large datasets). Stagraph allows you
to create plots in the interactive mode (vector plots with tooltip - zoom - pan - animation functionalities).
These features will be discussed in a separate chapter.
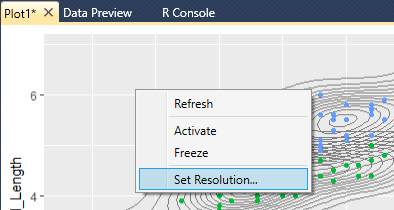
The Plot Document itself has only a few other functions (besides the data visualization displaying). If
you right-click on a graph, the context menu will appear. With the Refresh item, you can redraw
your current data visualization. This feature is useful if you change the main window size and you want
to spread the plot to new document size.
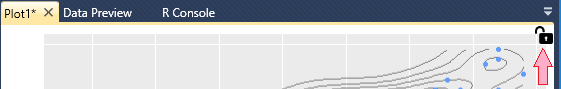
The Activate / Freeze functions are used to lock the document so that the current data visualization
is not redrawn. In this case, the next plot will be displayed in a new Plot Document that will be marked
as active. If you want to re-activate selected Plot Document, click on the Activate item in the
context menu. The same purpose has the Lock icon, displayed in the top-right corner of the document.
Finally, the last menu item remains - Set Resolution. Using this feature, you can adjust the
resolution of data visualization that is displayed in the Stagraph. The default value is set to 96.
If you have a high resolution monitor (e.g. 120 DPI), you can slightly lower this value and visualizations
will be rendered in more detail.
Data Preview Document
Another type of document that can be added to the Document Area is Data Preview. This document
you can display by clicking on the Data button in the ribbon toolbar.
The Data Preview Document looks like the following image. Its structure is very simple. It consists
of a table and a bottom panel. Data Preview Document displays preview of your datasets that you
import and pre-process in the background R runtime. Variable names are in the table header. Along
with their names are also listed their data types. This table does not contain all dataset records.
It only previews the first 200 lines.
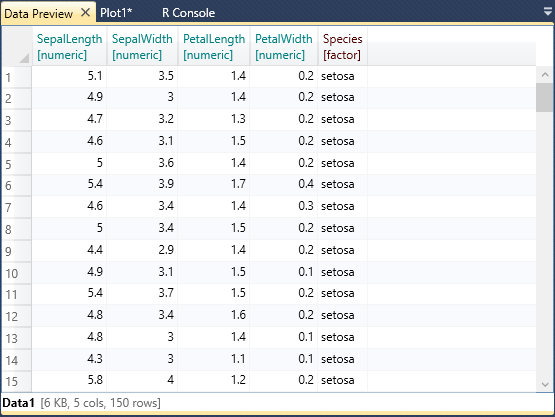
Below the table is the Info Panel that contains the dataset name, memory size that fill,
number of variables (columns) and number of records (rows).
Depending on how you edit the imported dataset (using functions from the Data toolbar tab),
these changes are reflected in the Data Preview Document. All edits of selected dataset are done
within the Properties Panel.
A complete description of work with the data is in two separate chapters - Data Import and Data Wrangling.
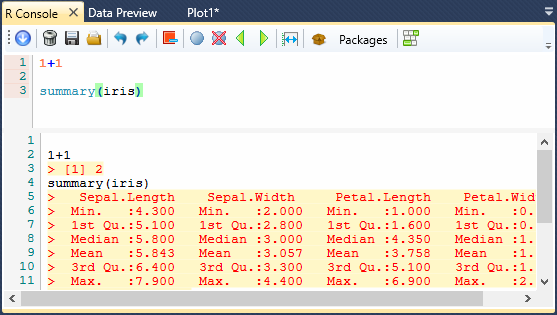
R Console
As mentioned above, the R terminal runs on the Stagraph background. Through the interface, you can
access it using the built-in features. If you are an experienced R-user, it may be an advantage to
have a direct access to the console, because you can use also other features of the R environment.
The Stagraph includes built-in simple IDE (integrated development environment), which allows you to
type custom R commands and analyze outputs. You can display this interface by clicking the Console
button in the ribbon toolbar.
R Console will be displayed in the Document Area. This console consists of a toolbar and two
code editors. In the top editor you can add your own R functions using features such as code auto-completion
or syntax highlighting. Ready R scripts can be sent to the R terminal using the first button in the toolbar.
Outputs from the terminal will automatically appear in the bottom editor.
Console toolbar has several features that can help you at work. These functions are accessible for both
editors. If you cursor is active in the top editor, the toolbar functions will be applied to the top editor.
If is your cursor focused on the bottom editor, all the features will be applied to this editor. In addition,
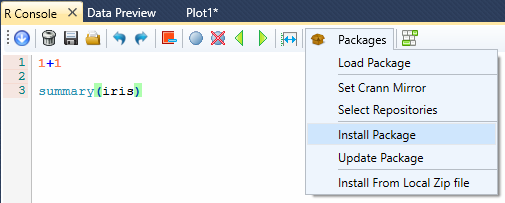
the toolbar includes functions for working with external R packages. Under the Packages menu, you can
find functions to install or update R packages.
Interface Conventions
Since the Stagraph is built as a GUI on top of the R terminal, the interface has one specific characteristic.
All the values you type as arguments (or properties) are directly transformed into R scripts. Examples of such
arguments are properties of plot geometry layers.
As properties you can type static values, R functions or you can map selected property to dataset (or dataset
variables). This may seem little unclear (at first glance), but very quickly you understand the power of this
approach. In this way, you are working in a simple visual interface (easy to understand and use) and on the other
hand, as a "power user" you are not limited by the interface. Your options with Stagraph will grow exponentially
if you will learn several simple R functions.
If you work with properties that are entered in text-boxes, it is important to take into account the background
color.
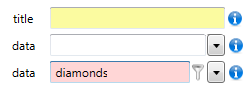
If the background is white, you can enter R function or value. If you want to type a value with string
character, you must enclose it into quotes (example: "Custom String"). For numeric values must be always
used the dot as decimal delimiter. (example: -1.23). If the text-box has light-yellow background,
the program expect a value in the string format only and your value is automatically (in the background) enclosed
into quotes.
The last background color type is light-purple. This type is used only for the data property, which
defines input data that you want to use in function. If your background color is light-purple it indicates that
on your dataset is an custom filter applied (on the level of function). This data filter you can create / remove
by right-click on the text-box (through functions in contextual menu).
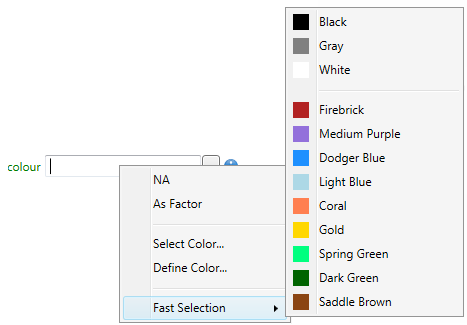
On the right side of each property (in the Properties Panel) is an Info icon. If you focus your mouse cursor
on this icon, the property description is displayed as the tooltip.
Definition of function properties can be sometimes tricky. Therefore, in addition to tooltip help, the program
interface contains another very important utility. When you right-click on the text-box, several options can be
displayed in the form of contextual menus. These utilities can help you to set the right value.
In this way, you can set individual properties very easily and quickly. On the other hand, if you will become a
more advanced user, the interface will not restrict you in your options. The only limit at work will be your
knowledge of the R language. The basic knowledge of the R language (simple R functions) opens you an incredible
options for your data import / data wrangling / data visualization steps in Stagraph.
After setting the value in text-box, just press the Enter key and changes will be automatically executed
in the R terminal. Output will be displayed back in the main window in the form or dataset previews and data
visualizations.