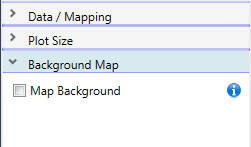
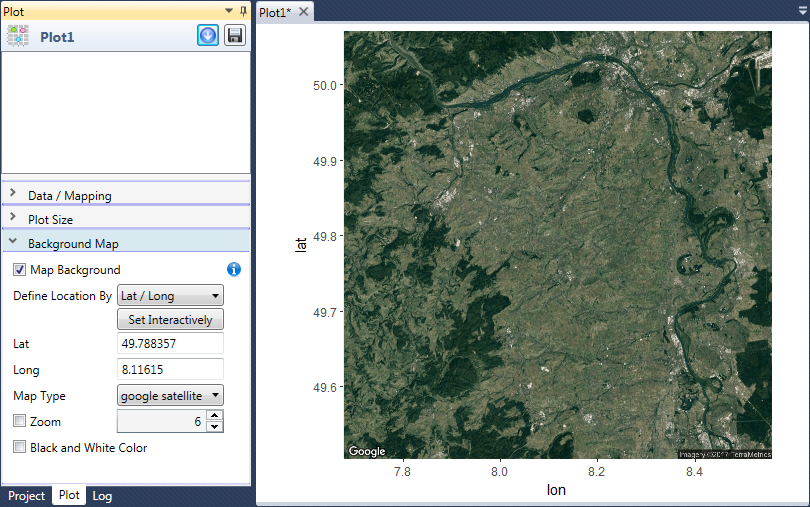
Background Map
If you are working with spatial data, it may be usefull to display
them on the basis of online background map. If you click in the
Plot panel on the header area, you will se the adjustable properties
in the bottom part, also with section named Background Map.
Using the properties in this section you can add to your visualization
an online background map. By default, the background map rendering is
deactivated. You can activate it by clicking on the Map Background
check-box. After this action several properties will be displayed, using
which you can setup the map.
This area contains several properties. If you change any parameter,
the program will download defined map from the Interned and insert
it into your plot. This download can little slow down the plot
rendering. If you (after the first plot rendering) did not change
these settings, next plot rendering will be faster, because program
use already downloaded map.
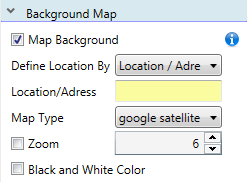
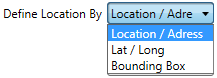
At first, you must in the combo-box Define Location By select
the way how you define the location on map. Overall, you have three
options. You can localize the area of interest by the Location /
Adress (geocoding), by the center point (Lat / Long
coordinate) or by the Bounding Box definition (left-bottom
and right-top coordinates).
Accoring to your choice are other settings activated and displayed.
If you select the Location / Adress option, you will see the
text-box into which you write (in lowercase) your desired location,
e.g. city, state, area or address. The program will try through the
geocoding to find the coordinates of the desired location and download
the map.
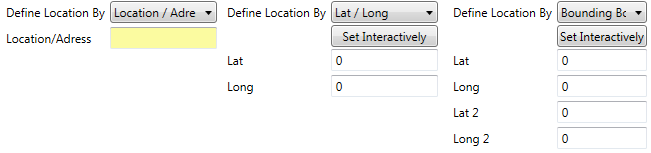
If you choose the second option (Lat / Long), you determine
the location on map according to the coordinates of the center point.
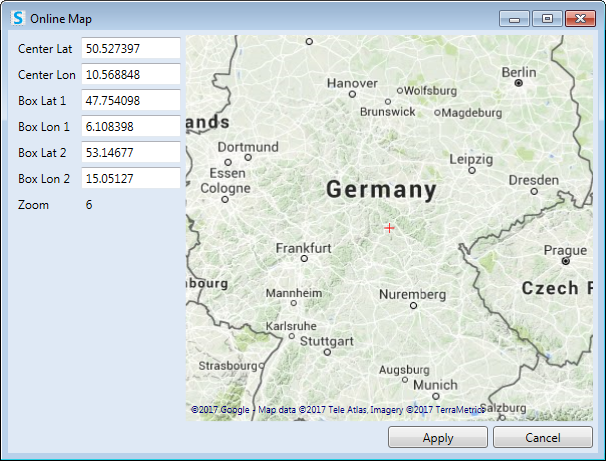
If you choose the last option (Bounding Box), you will set
the area of interest by the coordinates of bottom-left and upper-rigth
corner.
If you choose one of the last two options, you will see in the properties
area also button named Set Interactively. If you press it, a help
window will be displayed, where you can set the area of interest
interactively. After pressing the Apply button, required coordinates
will be automatically inserted into individual text-boxes.
The coordinates for map determining can be defined also according to
the values that are stored in dataset that you want to Plot.
Imagine that you want to define the map extent using the Bounding Box
properties. In your imported dataset (named MySpatialData) are
coordinates stored in columns Lat and Long. Miminal value
you can get using the following function, which you write directly into
the text-box:
min(MySpatialData$Lat)
This is an R function that selects from your dataset (MySpatialData)
values in the column Lat and calculates the minimum. Similarly,
you can define the upper extent if you change in function the min
string to max.
This record in relatively simple and is effective even if your spatial data
changes over time.
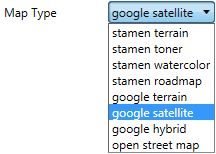
Then in the combo-box Map Type select a map provider that you want
to use. Program supports maps from three providers – Stamen, Google
Maps and Open Street Map. From the list you can select required
map type.
Subsequently, if you render your plot in Plot Document, Stagraph according
to your needs download map from provider and displays it as the background
of your plot. Then you can insert into plot your data as points, lines,
polygons and other predefined geometries.
By default the background map has always the shape of square with
equal sides. You can "trim" the displayed area using the parameters
xlim and ylim. These settings are described in the
section Scales – Position Scales.
In addition to the described properties, you can set two more options.
The first is the Zoom parameter. Under the previous settings,
program automatically tries to define appropriate scale in which the
map is displayed. If you are not satisfied with automatically defined
scale, you can change it using the Zoom property. The manual
definition is activated by the check-box and then you can change the
zoom value in the range from 3 to 21 (3 – continents, 10 – cities,
21 – buildings).
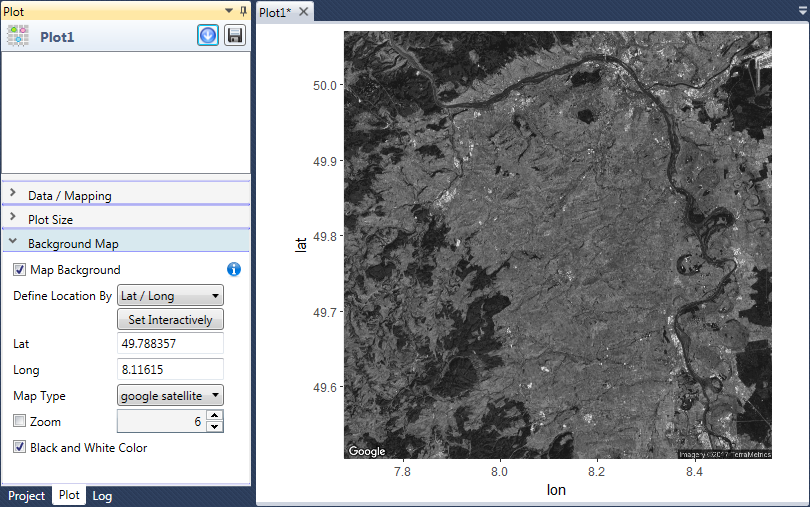
In some cases it is not useful to display the map in colors.
For this purpose, you can use the Black and White Color check-box,
which displays your map as black and white image. Some geometries (and
aesthetics) can be more readable in this view.
If you have set the background map, you can proceed to Plot your
spatial data. For this purpose you must specify the dataset that you
want to use. This issue covers the following chapter.