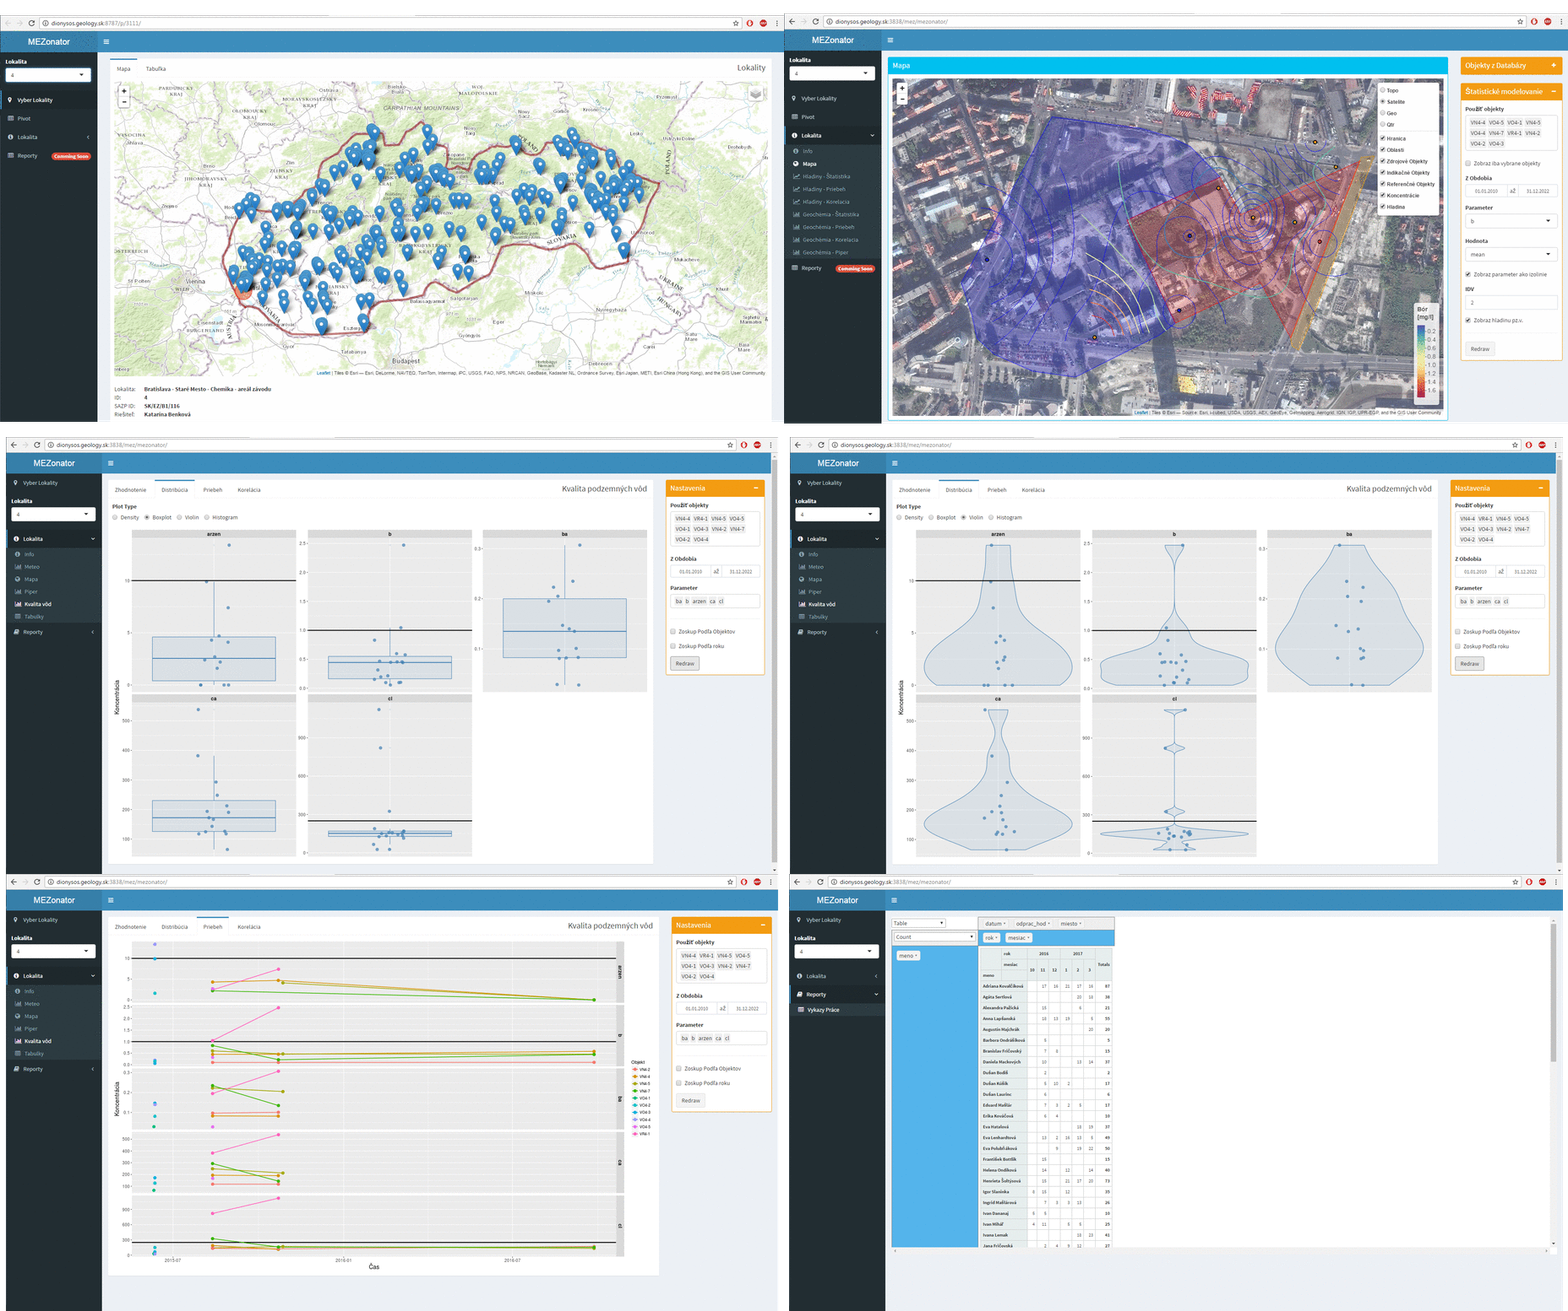
At the Geological Institute, we are responsible for monitoring of 314 contaminated sites in Slovakia. On the project gradually works about a hundred people in four offices (water sampling, geochemists, hydrogeologists, laboratory technicians, technical staff …). With such numbers of localities and staff, it is difficult to follow and control the quality of monitoring and ensure the consistency and completeness of the data. Therefore, we have created on an internal server (Ubuntu Linux) a database (PostgreSQL) in which we store all information and data such as spatial information about localities (e.g. source – indication – reference areas), about monitoring objects (wells, springs, rivers) , chemical / isotopic analyses of waters / soils, continuous data from data-logers, work reports and many others.
For data entry and editing, we’ve created online forms. The project has been running for a number of years and the amount of data is growing fast. So it was necessary to create application for data access, display, algorithmically and visually control, statistically process and export in multiple forms and formats. The boundary conditions that we have are as follows:
- We have one operative server available
- The data are stored in the PostgreeSQL database
- Application must display data in the form of tables, graphs and maps (flexibility)
- Since the database is constantly edited and built, we must have full access to the definition of the application object model and interface
- The application must run online from the server without installation on the user’s computer
- It must be a system that we are able to create and maintain
- We prefer Free/Open Source solutions
- Development must be fast and the first outputs we need ASAP

Due to these boundary conditions, we could not use standardized large systems that are available on the market. When I got this task personally, I could choose the technology I want to use. I also got the freedom to define the architecture and user interface of the resulting application.
Recently, I working often in R language and for a long time I have been following the Shiny framework (a web application framework for R). I wanted to try it, but I did not have appropriate project where I would use it. The described project appeared to be ideal. And it was true. Thanks to this framework, I’ve changed my feel of the web application usability in my field. The development in this environment is very fast and the options are almost unlimited. Previous screenshots are a preview of what can be done in about a month of work if you’ve never used Shiny before, and you only have experience with R language use in data processing and visualization.
If someone tells you about the R language, it’s mostly a professional programmer, statistician or data scientist. In this series, I will describe the technology as a geologist who has some experience in programming and statistics.