In the last year, three versions were released. Version 1.0 contained only the basic functionality. Just one month later was released a major update of ggplot2 package, on which is Stagraph based. This update was reflected in the Stagraph 1.1. In the summer was released Stagraph 1.2. Version 1.2 did not contain any new features, only improved existing functionality and problems.
Since the last release, I’m working on a new version – Stagraph 2.0. The difference in functionality and capabilities will be crucial. To the program is added support for additional packages, which extends the options of statistical graphics. New geometry layers have been added (such as the horizon plot, mosaic plot or treemaps), advanced were also statistical layers and introduced are annotation layers. Screenshot from the new version shows some new features – new geometry layers, annotations, scales and combination of several plots in one image.
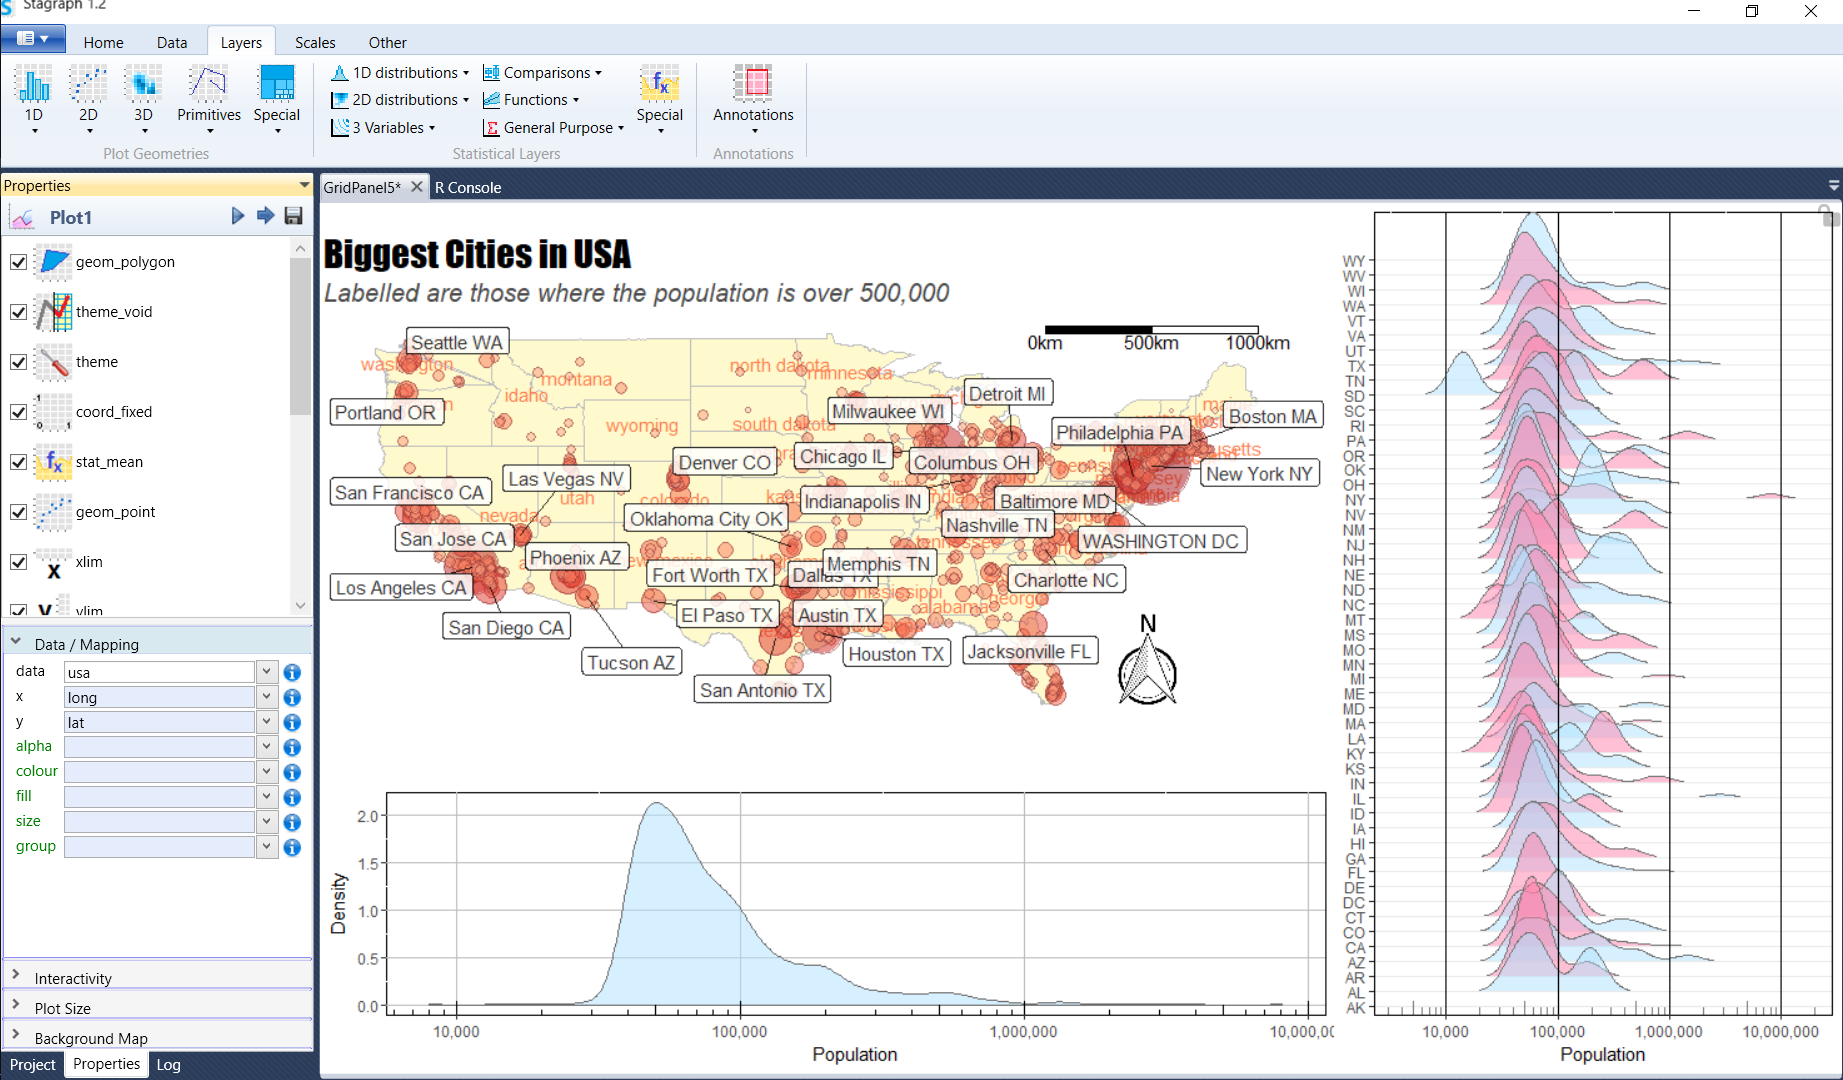
In the new version, you can create richer plots and combine them in one final data visualization. Thanks to the new functions of user interface, it is very simple and fast.
Another significant improvement are interactive plots. Thanks to the plotly library, you can create plots that includes support for interactive functions such as zoom, pan, selection or tool-tip. It will also be possible to create animated plots.
In the following posts, I’ll introduce individual news of Stagraph 2.0. The planned functionality for 2.0 version is now ready for 80%. The preview version could be released for testing within two months. Then I will continue to complement the user manual and more I want to work with users (support, use cases, tutorials, tips & tricks, explanation posts).
Over time, the Stagraph becomes a comprehensive tool for data scientists. I have several other ideas for the future versions. I want to fundamentally revise the interface for data import, data cleaning, reshaping and data pre-processing. I think it is possible to create visual interface, where data processing is as simple and straightforward as creating graphs in Stagraph.
On the other side, there are also wide options of visualization publishing and in the integration with other tools and third-party services.