What you can do in Stagraph?
Stagraph is a tool for data import, data wrangling and visual exploration / statistical graphics. For data preparation you can use 87 built-in functions. For visualizations, you can use a combination of 80 geometry layers, 50 statistical functions, 7 annotation layers, 90 scales, 7 coordinate systems, 6 plot faceting options and 28 plot themes.
With these features, you can quickly and efficiently create impressive data visualizations without the need of programming. The examples are shown in the following animation.
All visualizations you create in Stagraph can be exported as R scripts and used in Power BI Desktop.
Stagraph allows you to export R scripts only in the Professional Edition. In the Free version, you can create selected chart types, but you can’t export them.
How to use Stagraph from Power BI Desktop?
If you want to run Stagraph from Power BI Desktop, we assume you’ve already connected them. This connection was introduced in the previous article.
See also: Stagraph & Power BI Desktop [Part 1]
The following text describes in detail how to use Stagraph from Power BI Desktop. Real use cases are shown in the video-tutorial.
If you want to add Stagraph plot to Power BI, insert the R script visual object from the Visualizations Panel to your dashboard. Subsequently, in the Fields Panel select all the variables that you want to work with.
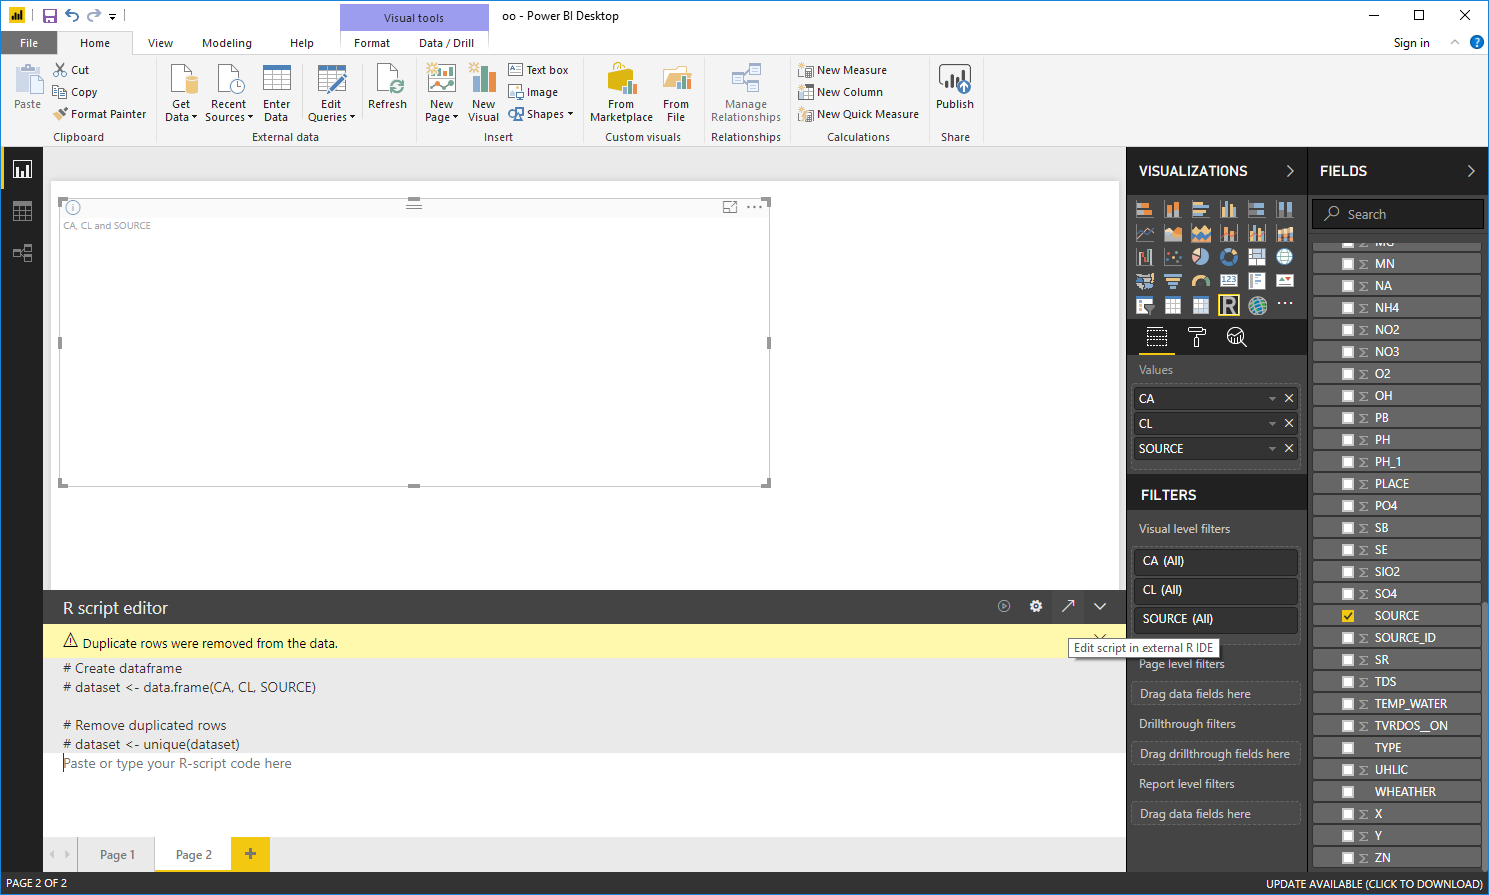
After variables selection, in the R script editor is a custom script created that defines your dataset in the R Runtime. This data object is named dataset and will form a data.frame object. To this editor you can insert the R script that creates the desired plot.
You can type this script manually or you can use an external IDE / GUI editor such as R Studio or Stagraph. Click on the third button in the R script editor header. The Stagraph will show with the R script (in integrated R Console) that loads the selected data from Power BI. Select this script by mouse and execute it with the first toolbar button (Run Selected R Code).
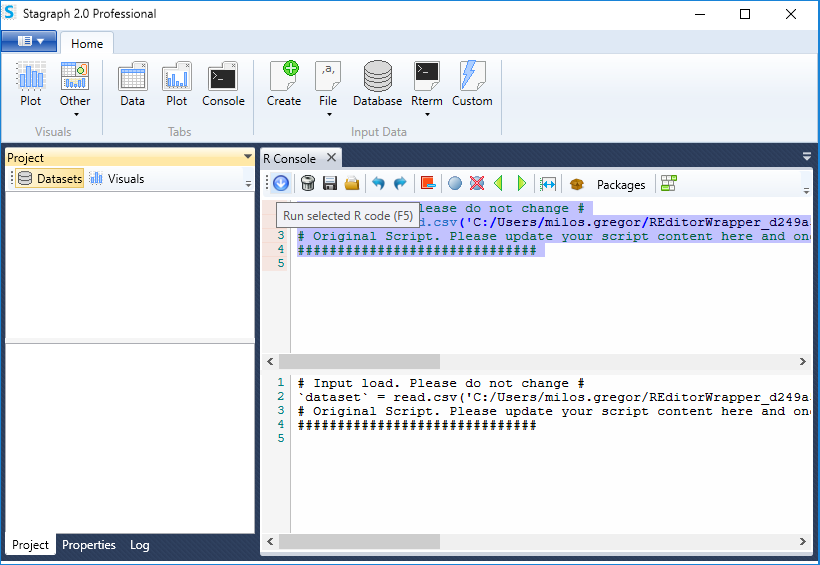
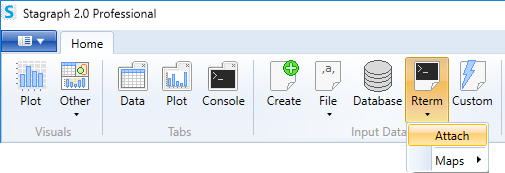
Your script is executed in the background-running R Runtime. Now we need to load it also in the Stagraph interface. We use the data_attach function - click on the R_term button and in the menu choose the Attach item.
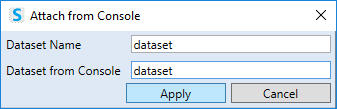
A dialog will appear in which you define the name of the dataset that you want to use. Define also its name for the Stagraph interface (in this case, the same).
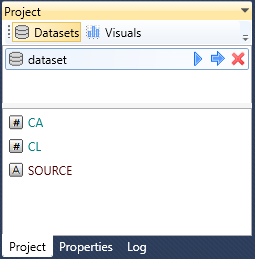
After pressing the Apply button selected dataset is loaded into the Project Panel. In the following example, we see a dataset with three variables - calcium and chloride concentrations in groundwater (numerical values) and categorical variable defining the type of groundwater source.
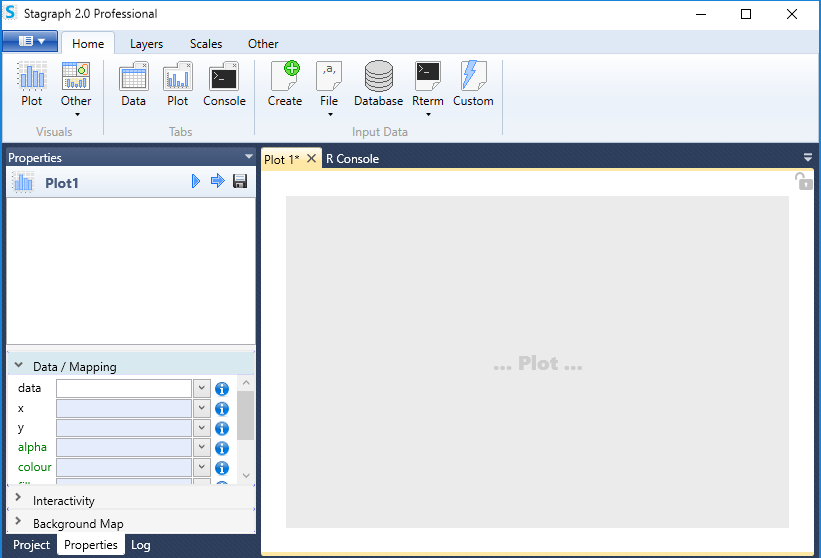
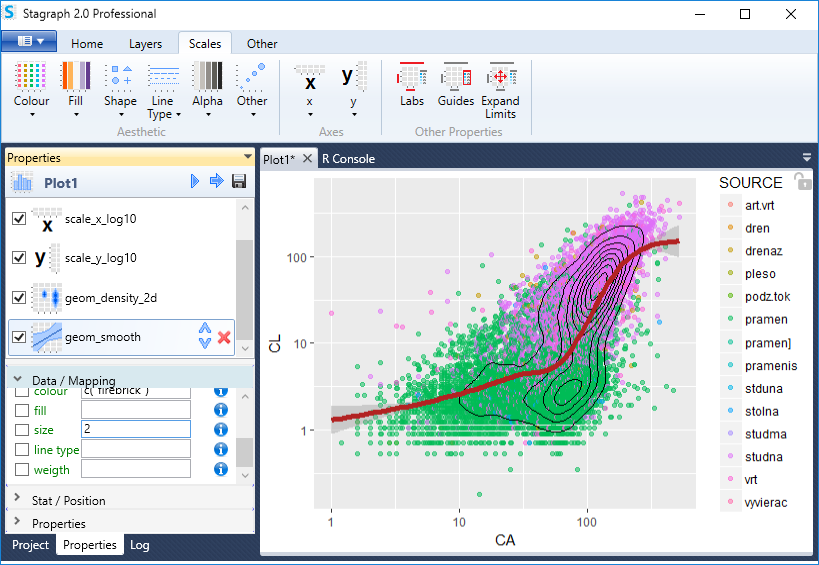
After this step, you can create the desired chart using built-in Stagraph features.
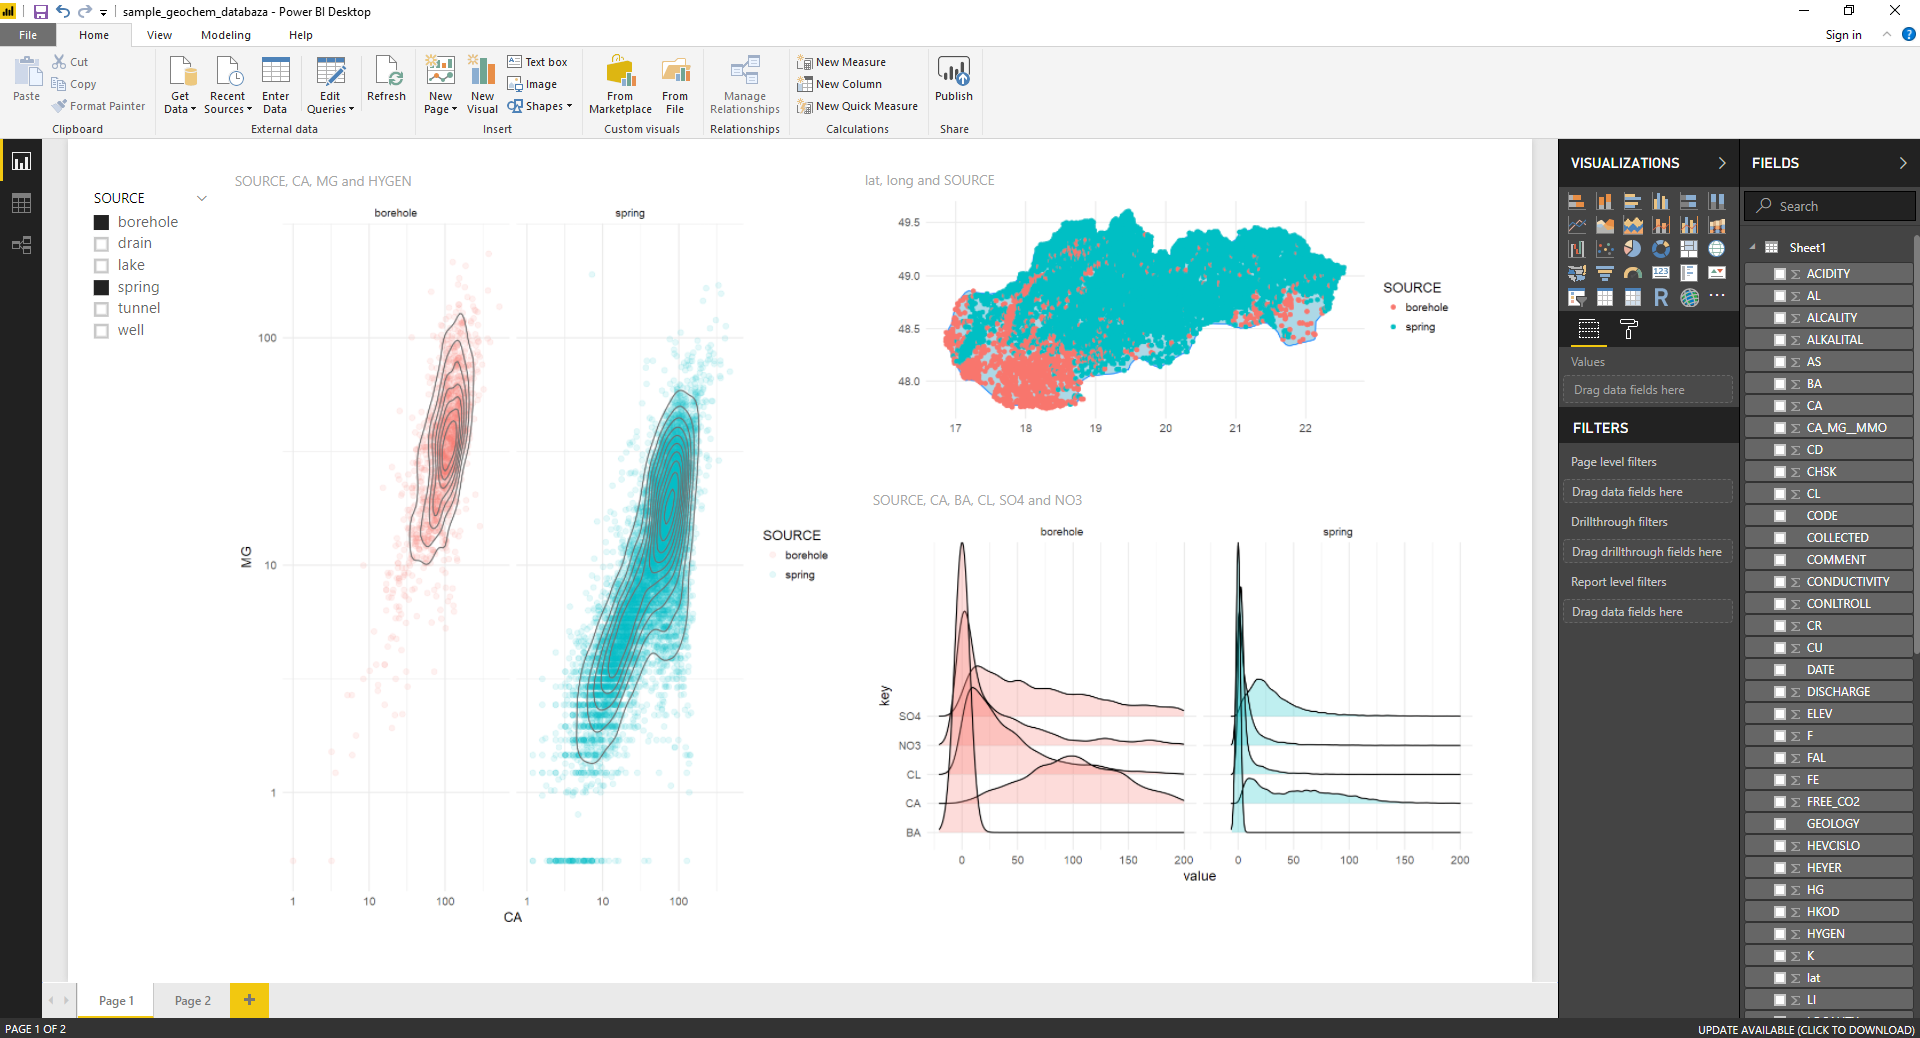
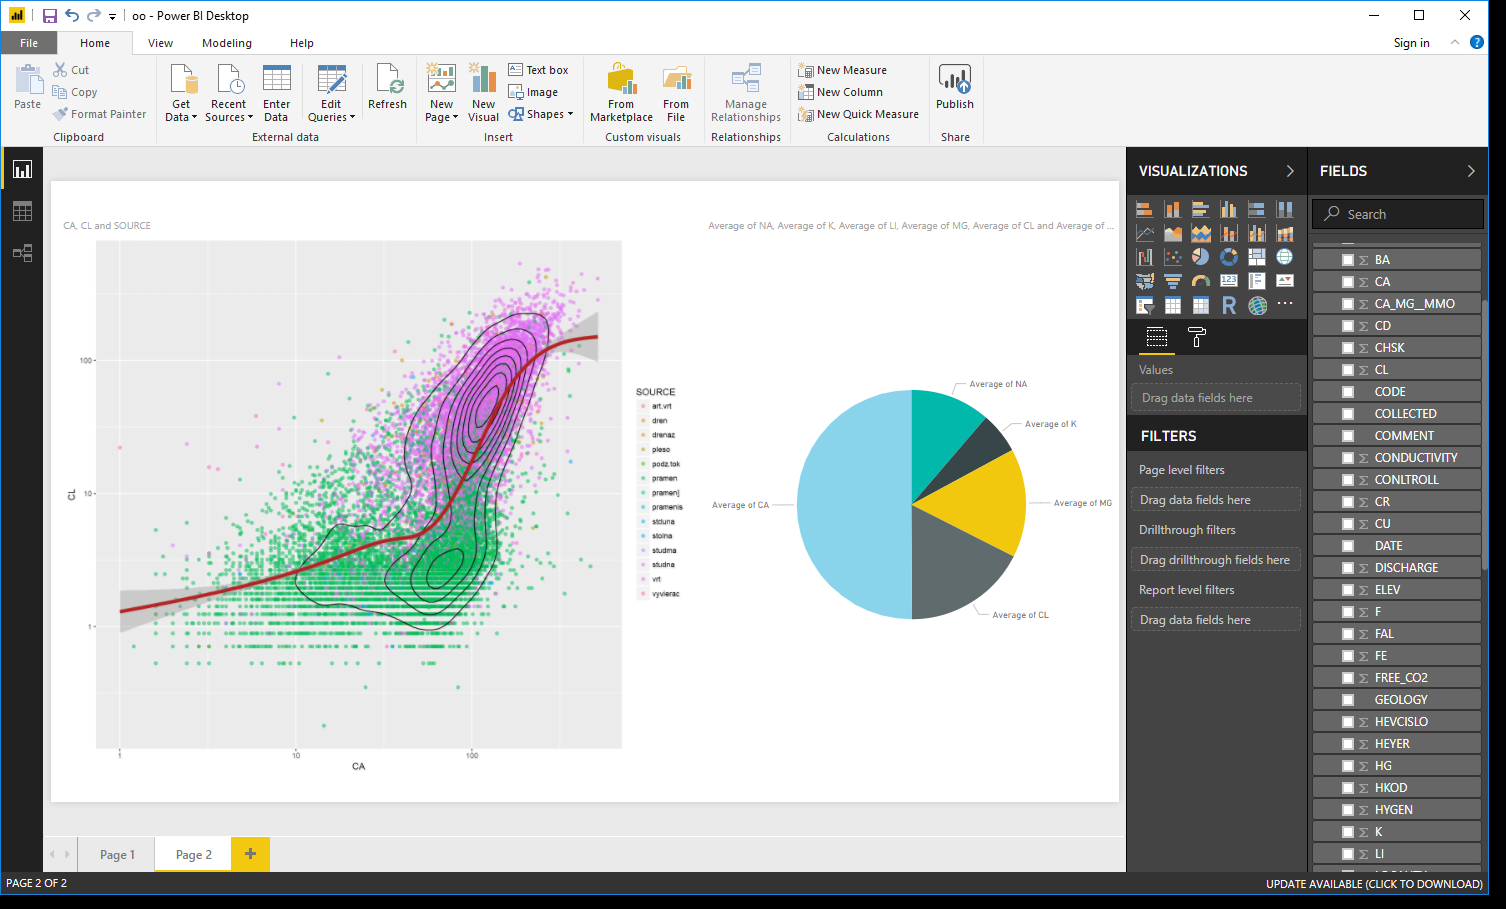
If you have the visualization ready, you can export it back to Power BI. In the following example, we created a scatterplot of the relationship between calcium and chloride concentrations in groundwater. The points color is mapped to the type of groundwater source. In addition to the point layer, we added also line geometry that represent the 2D density estimation (black lines) and a layer describing smoothed conditional means (red line).
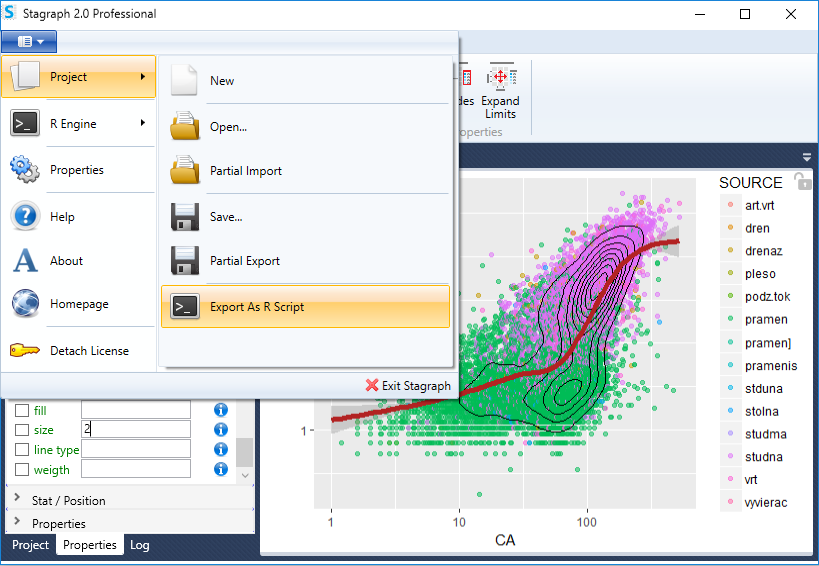
The plot can be imported back to Power BI as an R script. The complete script of your plot can be obtained by clicking under the Application Main Menu Button on the Project > Export as R Script item.
A new window will appear. This window contains the R script that defines your data visualization.
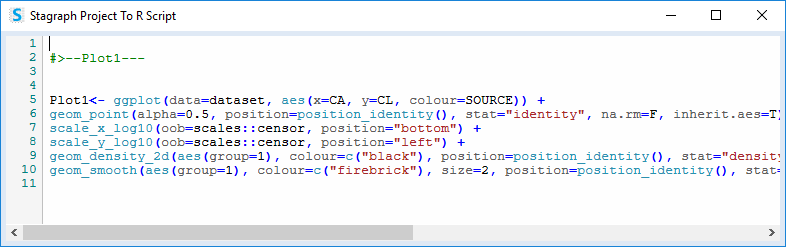
Select this script and paste it to the R script editor in Power BI (Ctrl+C & Ctrl+V). This script only defines the plot. If you want to display the plot, at the end of the entire script put its name - in our sample Plot1. Note that R language is case sensitive.
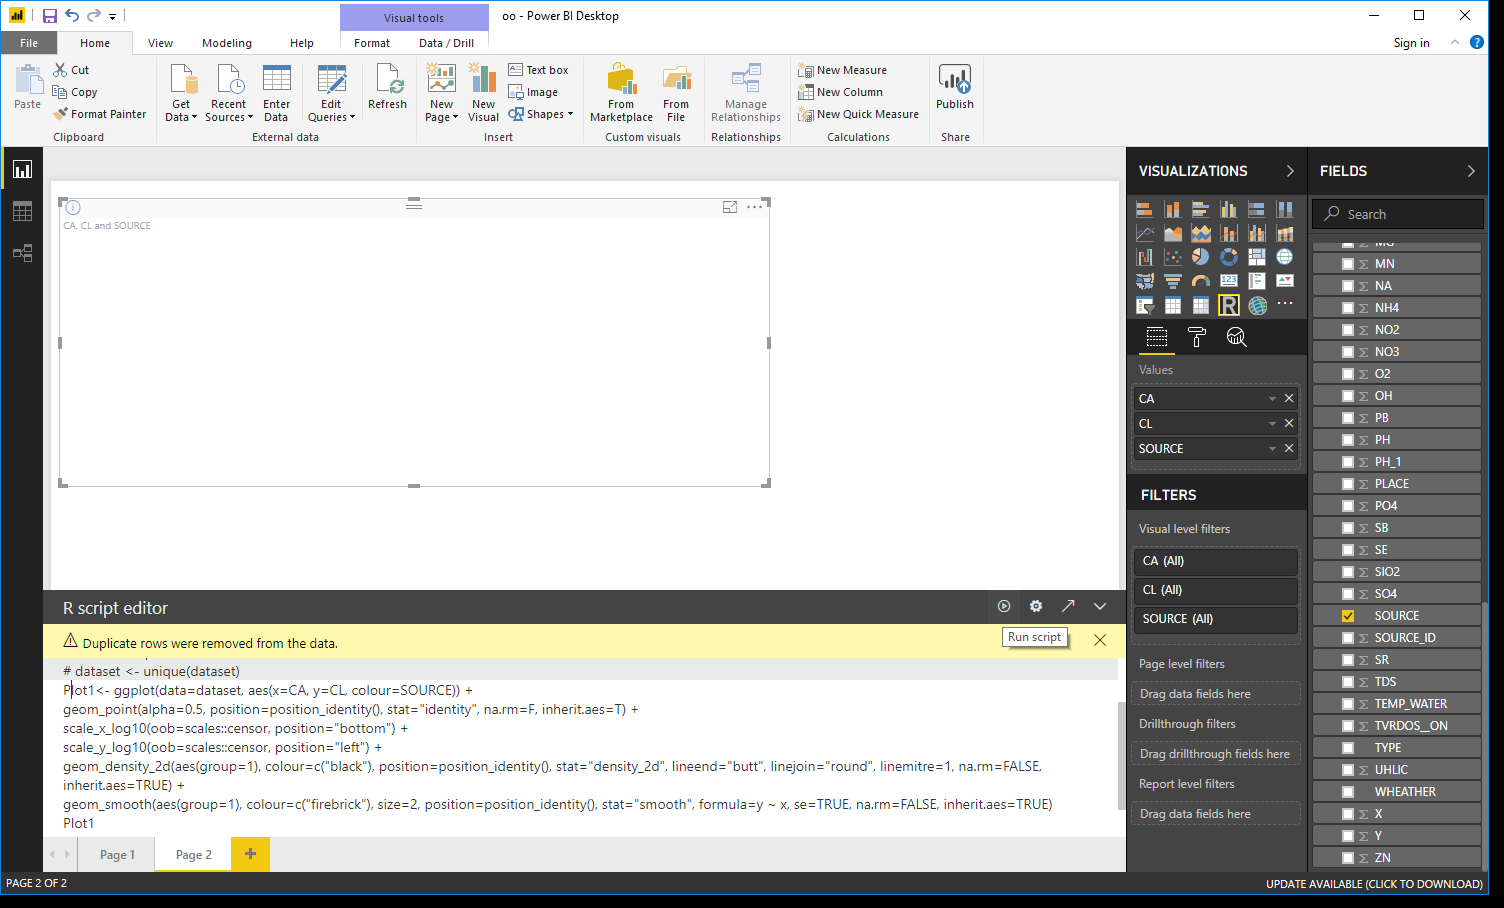
After inserting the script, just press the Run script button in the panel header and you plot will appear in the dashboard. Individual R script visuals you can combine with other Power BI visuals.
If you combine Stagraph with Power BI Desktop, you get a very useful tool for creating interactive and highly customizable statistical graphics. On the other hand, their creation is relatively simple and you do not need deep knowledge of R programming (knowledge of at least the basics can exponentially expand your options).