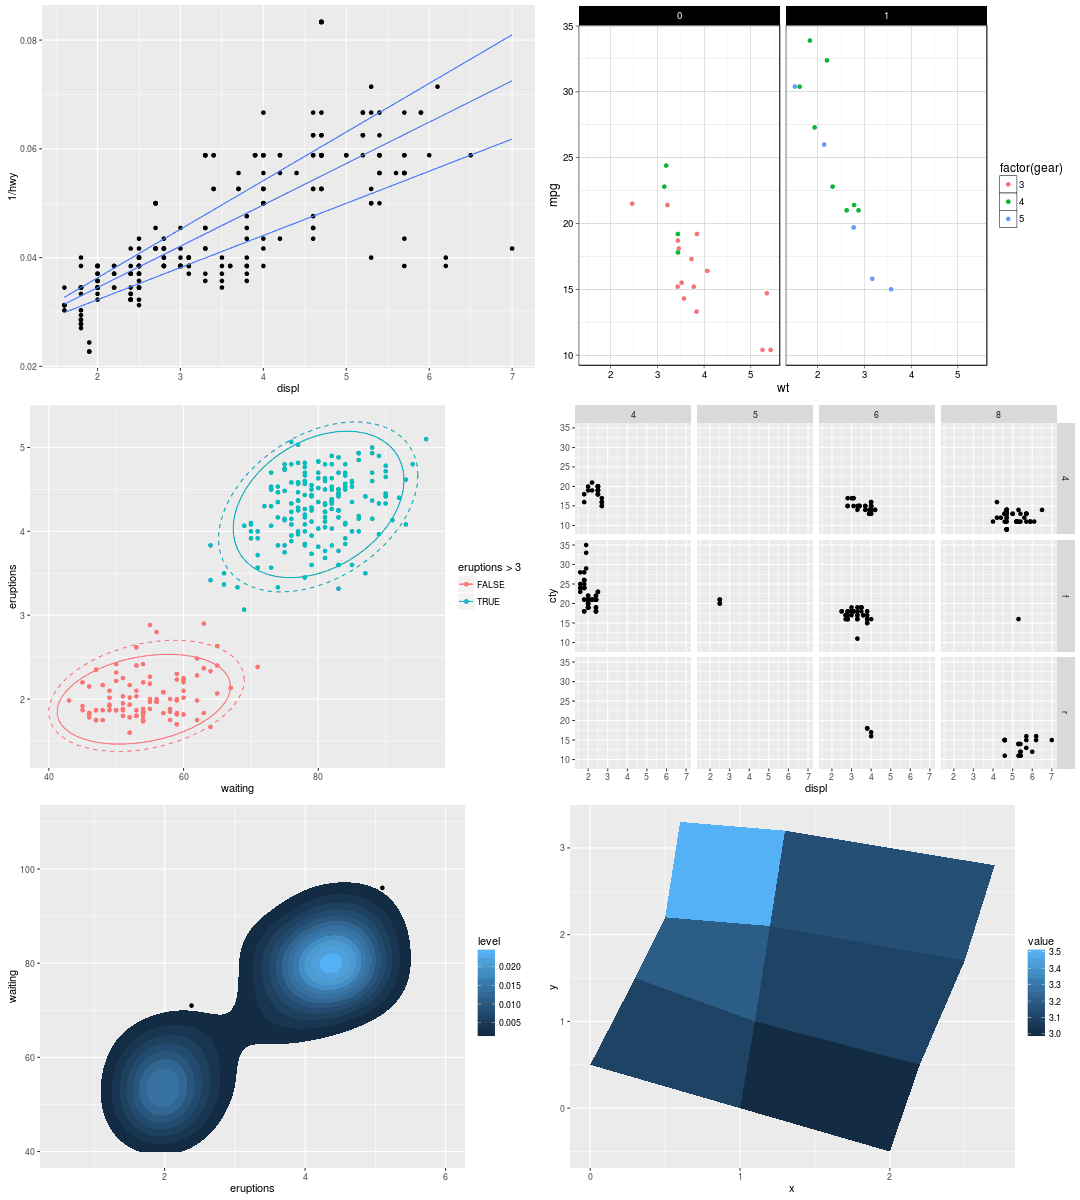
According to author (Hadley Wickham) „the ggplot2 is a plotting system for R, based on the grammar of graphics, which tries to take the good parts of base and lattice graphics and none of the bad parts. It takes care of many of the fiddly details that make plotting a hassle (like drawing legends) as well as providing a powerful model of graphics that makes it easy to produce complex multi-layered graphics”.
With ggplot2 package you can create charts on a high level of abstraction. It is a very flexible tool, where the user independently creates and combines various “blocks” of statistical graphics, until required statistical graphics meets the requirements. By “block” can be in a simplified form understood selected geometry such as point, line, bar or box plot. Overall, ggplot2 contains more than 40 geometries.
For each geometry are by default predefined some parameters. The user then defines used data, sets aesthetic parameters, selects desired geometry, statistical transformation, adjusts scales (X, Y, colour, size, alpha, shape type), coordinate system (cartesian, polar, map, …), geometry position (stack, dodge, fill, jitter), sets the faceting (display of multiple graphs in parallel with subsets of data). In the result, you can create charts and its combinations as in the following example.

Individual geometries can be in graph combined. For the average user can be disadvantage to
define graph in R language (with ggplot2 specific functions). For purposes of simplification, the Stagraph software was created. You can create these charts visually and program automatically generates required code in R language and sends it to hidden console in the background. Using Stagraph, you do not have to write even a line of code. The program automatically generates code for data import, graphs creation and also for its export in various formats. In addition, the program also makes it easy to define the data preprocessing. All these functionalities will be described later.
Although the user does not have to write even a line of code, it is a great advantage if you know at least the basics of the R language and ggplot2 package, because you can radically expand the capabilities of visualization, but it is not a requirement for using the Stagraph. As a very good source of information about ggplot2, I consider the book from package author. Quick overview of the ggplot2 options brings the following two videos. A complete description of the package functions is also listed on the ggplot2.org website.