 data_r
Stagraph is based on the R Runtime. It basically forms a user interface on the top of this environment. However, if you have some knowledge of this language, you can use it directly in the program. To use R for data wrangling, the data_r funcion will help you.
With this feature, you can paste custom R scripts into your data processing. Using this function, you can take full advantage of the R environment - basic functions or functions from external R packages. The following video-tutorial shows how to use the described function.
As you can see from the video, you can use data_r as for data wrangling as well as for custom R scripts to help you simplify or streamline your workflow. In the following text we will introduce the data_r function in detail.
Description
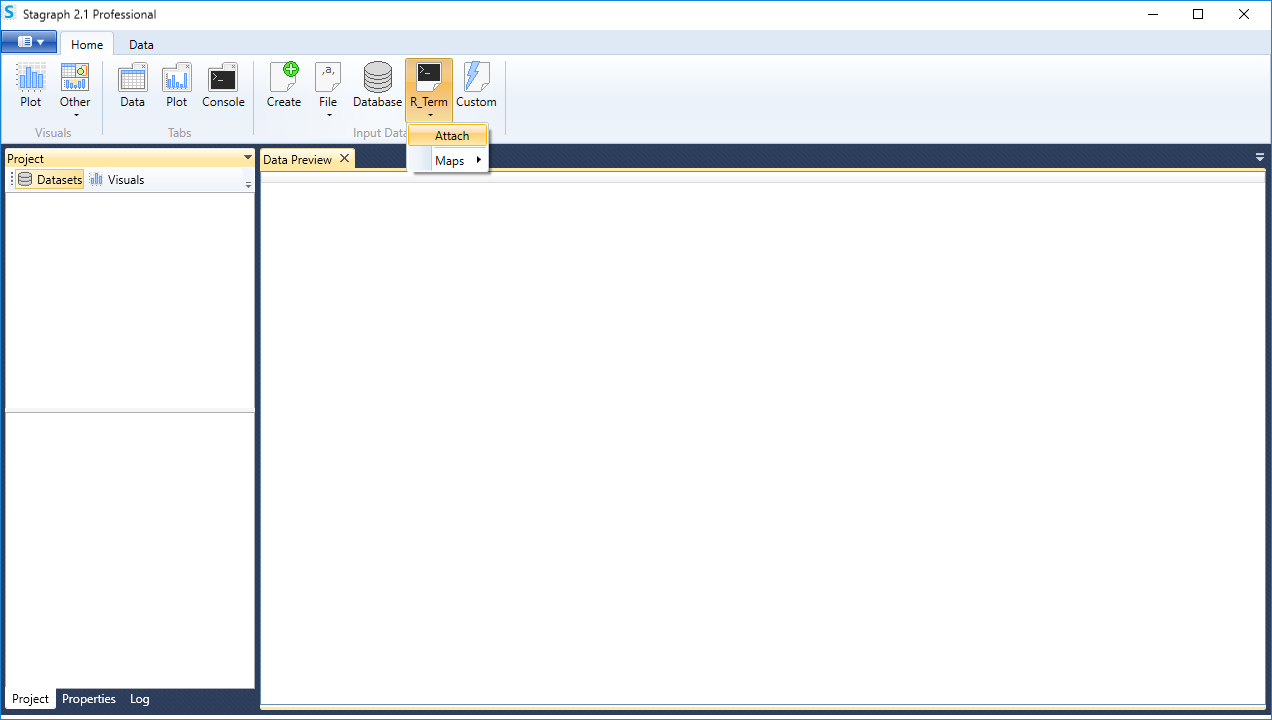
In order to use the data_r function, we need to import sample data into the program. We import data from R Runtime using the data_attach function. Click on the R_Term - Attach button in the ribbon toolbar.
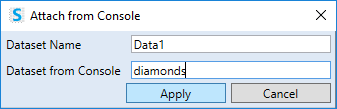
A help dialog is displayed in which you define the sample dataset that you want to use. In our example, we use the diamonds dataset. We will write its name to the second text-box (Dataset from Console) and click the Apply button.
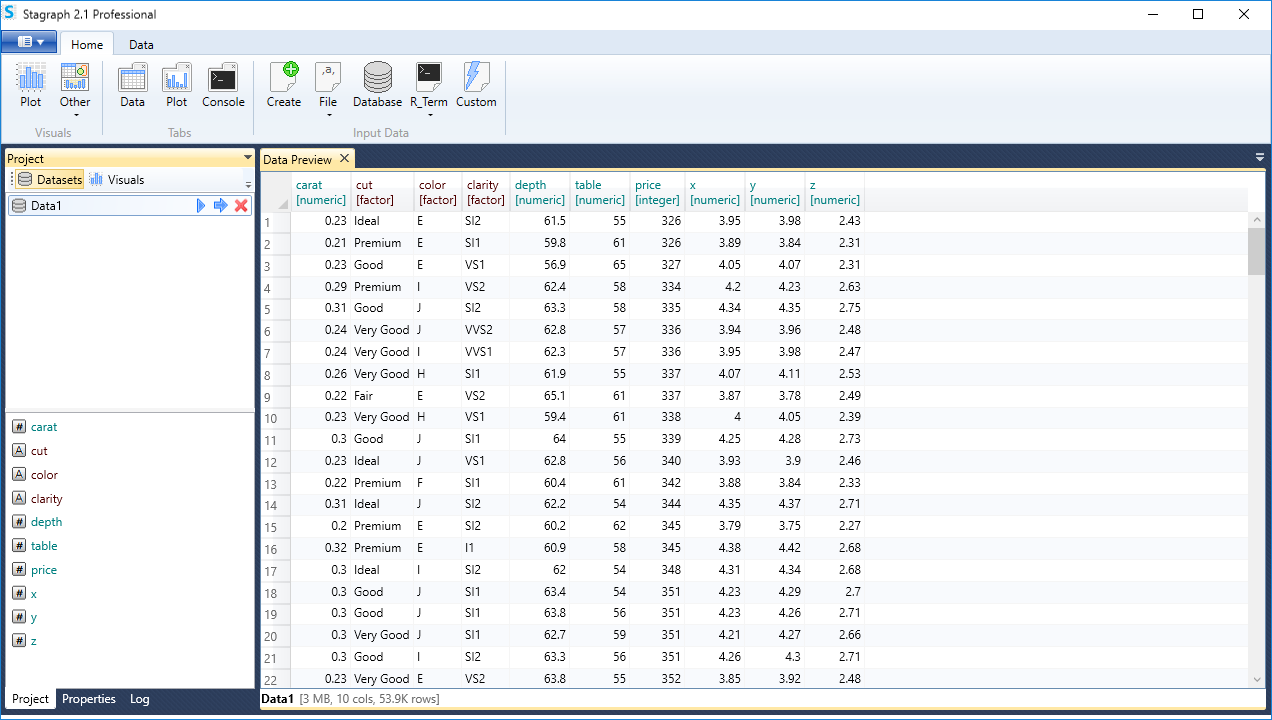
After importing the dataset appears in the Project Panel and also in the Data Preview Document. As we can see from the following figure, it’s a dataset that contains 10 variables and more than 53,9K records. We want to edit this dataset using custom R scripts.
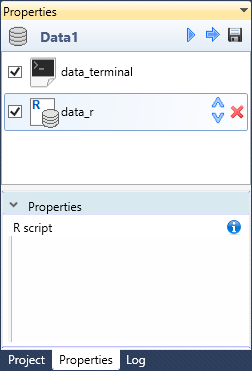
If you want to add your custom R script, double-click on the selected dataset in the Project Panel and its definition will appear in the Properties Panel. Then click on the R button in the ribbon toolbar tab Data.

Clicking on this button adds a new function in the Properties Panel with the name data_r. If you select this item in the list, the R Script Editor will appear at the bottom of the panel, where you insert custom R scripts. This R Script Editor includes features such as syntax highlighting or code autocompletion.
The following example shows a custom R script application on the imported dataset. With the features of the dplyr R package, we have statistically processed the dataset. From the input dataset we choose cut, carat and price variables. Then we grouped all records according to the categorical variable - cut and we calculated the averages of carat and price variables in individual groups. The result is displayed in the Data Preview Documents.
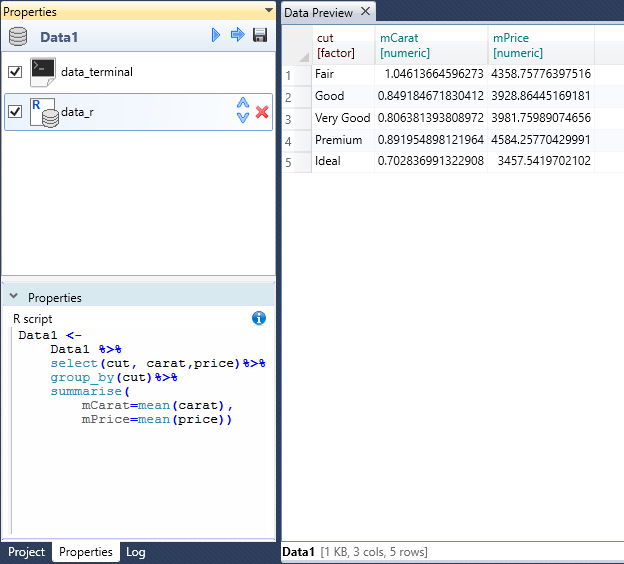
Basically, when writing your custom script, you have to observe only one condition - the result of you script must be a data.frame object with the identical name as the dataset in the Stagraph project. In our example, it is Data1.
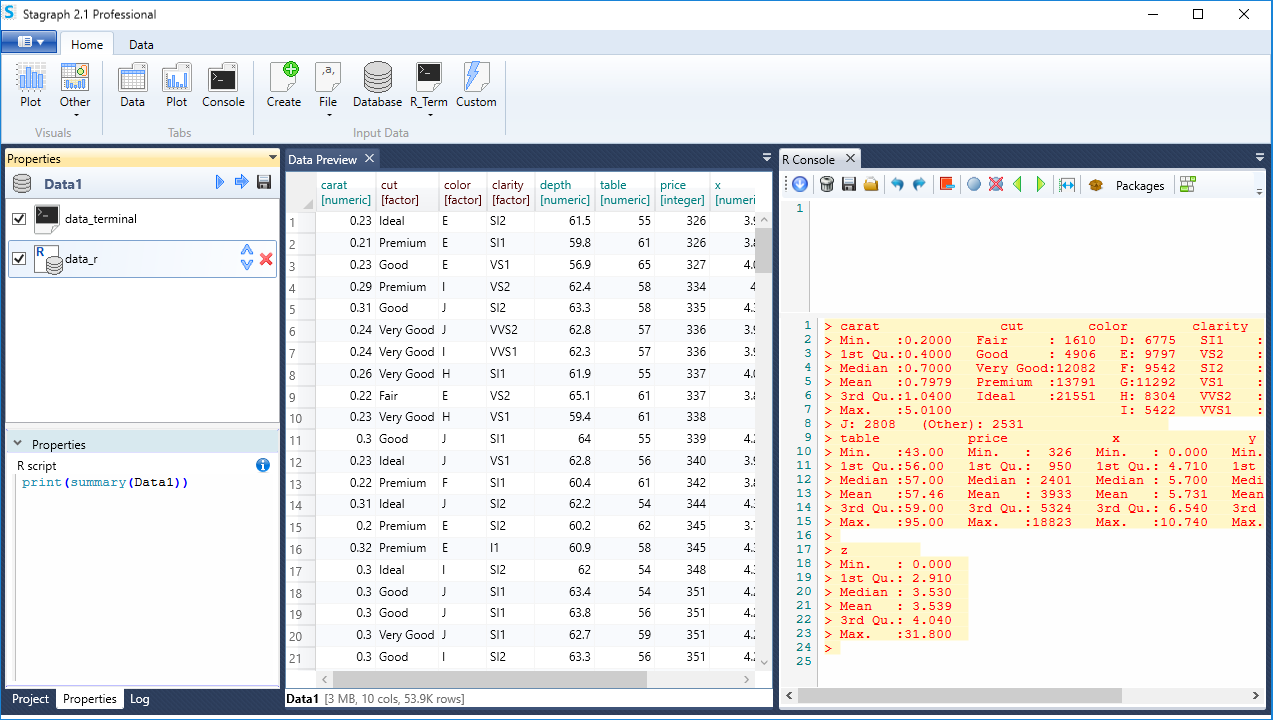
The data_r function does not need to be used only for direct dataset editing and statistical processing. The example is shown in the following image. In this case, we use the data_r function to display selected information about the dataset (in the built-in R Console) during the data processing. In the Stagraph we displayed R Console and we want to display summary information about the dataset every time we click the Execute Dataset button.
For this we have put the following script in the R Script Editor:
print(summary(Data1))
This script displays a summary of all variables in the dataset. You can use this feature if you apply extensive or advanced data wrangling functions to the dataset. In R Console, you can display information that is not clear from the preview in the Data Preview Document.
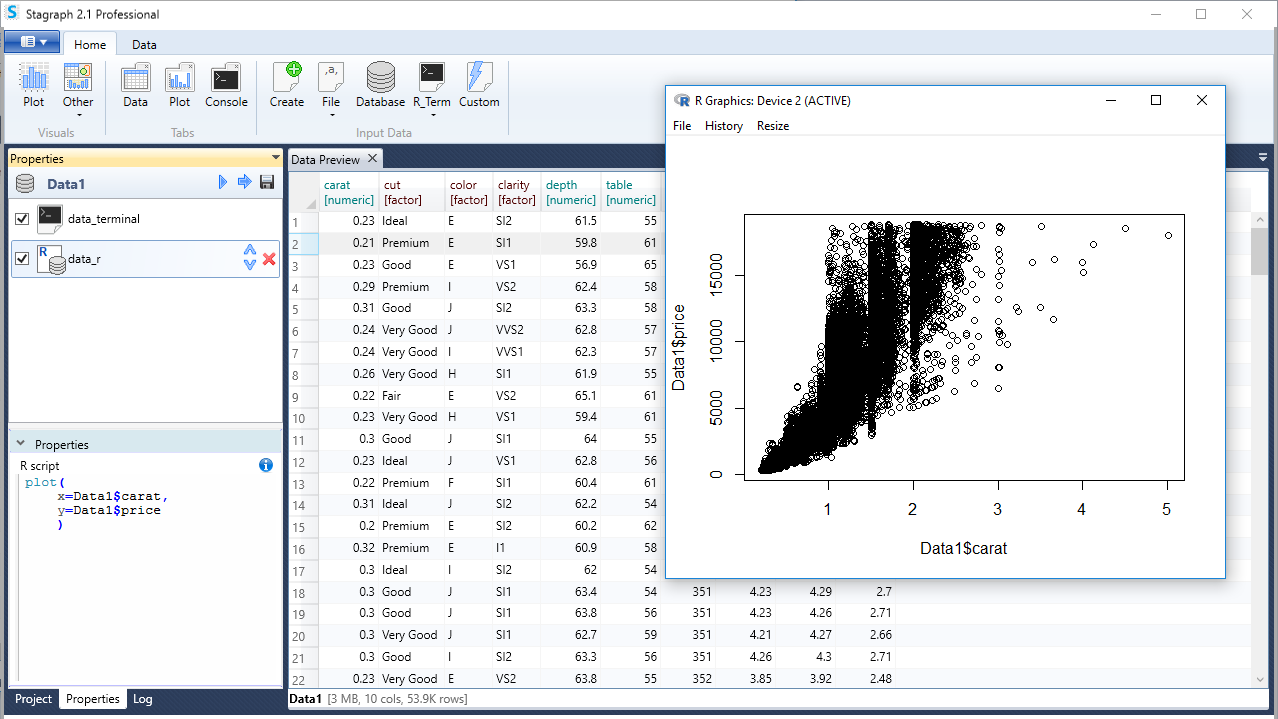
The following example is similar. In this case, we do not display information in the R Console output-box but in the form of data visualization in an external window - R Graphics Device. We added the following R script to data_r function:
plot(x=Data1$carat, y=Data1$price)
This script displays a simple scatterplot relationship between the carat and price variables. The graph is refreshed each time you click on the Execute Dataset button. This application is useful if you filter dataset records according to multiple variables. You can instantly see the effect of inserted filters on the resulting dataset.
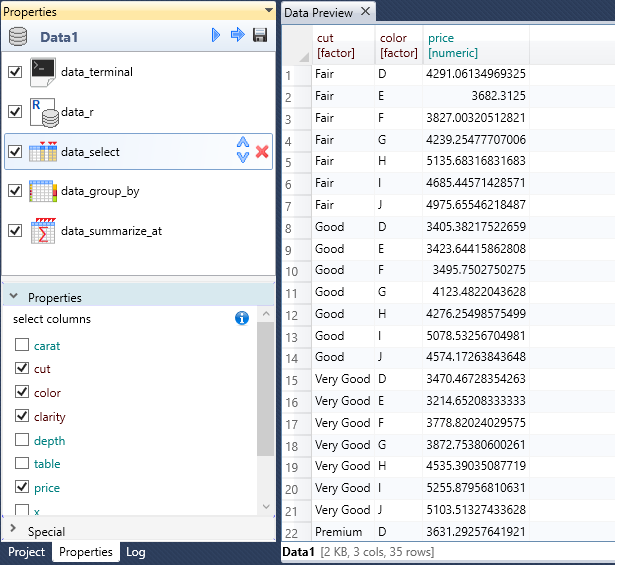
As with other data wrangling features in Stagraph, you can combine the data_r function with other features. The following figure shows an example where we applied data_r to the imported dataset. In the following processing steps we used the other built-in data wrangling functions - data_select (select dataset variables), data_group_by (create groups according to selected categorical variables) and data_summarize_at (summarization of selected variables using a defined statistical function). From the imported dataset we’ve selected required variables. Subsequently, based on the categorical variables cut and color, we created groups of records. Finally, in these groups we calculated average prices.
The data_r function greatly expands your data processing capabilities in Stagraph. With this feature you can use the full power of the R language. It is useful for processing steps and application of statistical functions that are not integrated into the Stagraph visual interface. But you need to know this language for its use.