How to Group Aesthetic
Last aesthetic property that you can define (for selected geometries) is
group parameter. This parameter does not define any direct visual
aesthetic but divides data into groups without any aesthetic
diferentiations (e.g. color, size).
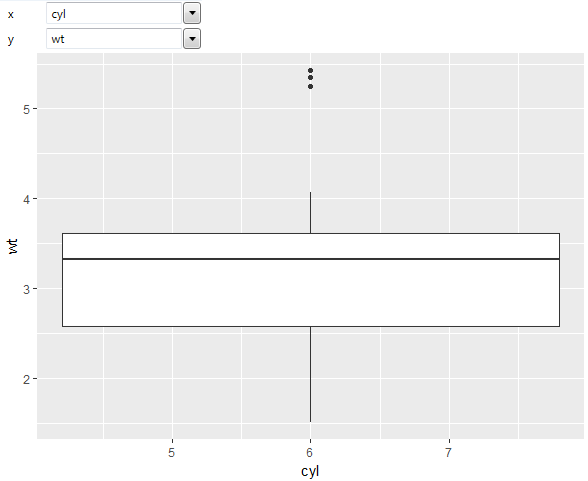
As an example, we can use geom_boxplot with build-in dataset mtcars.
Position scales we define according to variables cyl and wt. Based
on defined aesthetics, we can assume that the program will create
individual boxplots for unique cyl values. Instead, the program
creates one boxplot for all values. An example is shown in the following figure.
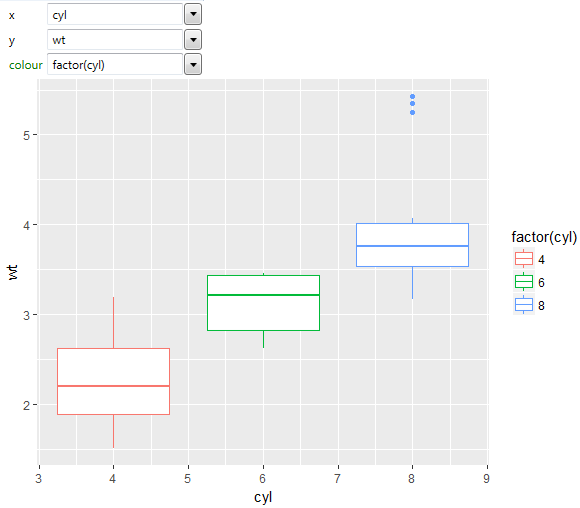
To display boxplots for each unique cyl value, you can create a
group indirectly, when you define boxplot color aesthetic according
to cyl values. The program then creates a separate boxplots for all
cyl values (4, 6 and 8).
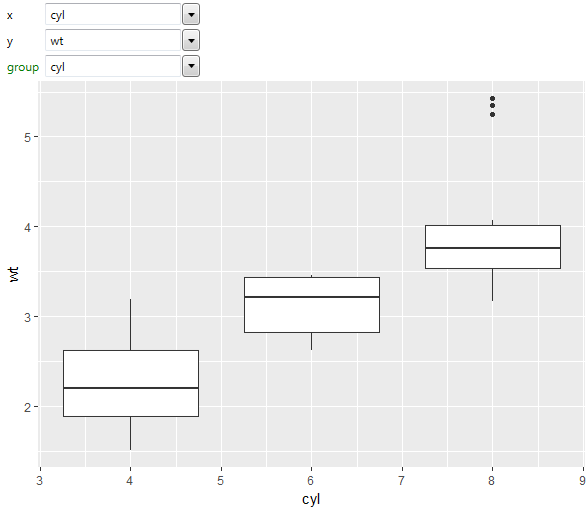
If you want create boxplots that will be visually indentical
(boxplot color), use the group aesthetic. After definition the
group aesthetic, the program divides values into three groups
according to specified parameter and renders boxplots with the
same easthetic properties. An example is given in the following figure.
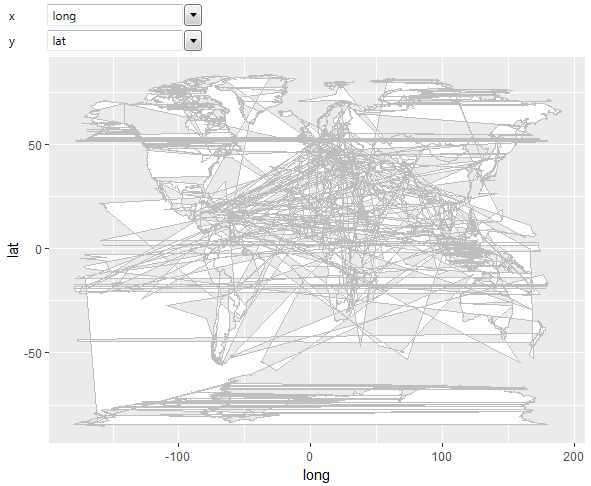
Another example may be geom_polygon layer. If you have your data stored
in the long format (coordinates of polygons verfexes are stored in
two columns – x and y), you must define how are indivisual polygons
divided. If you define the position aesthetics according to these
varaibles, program creates one big polygon that will be similar to
the following example.
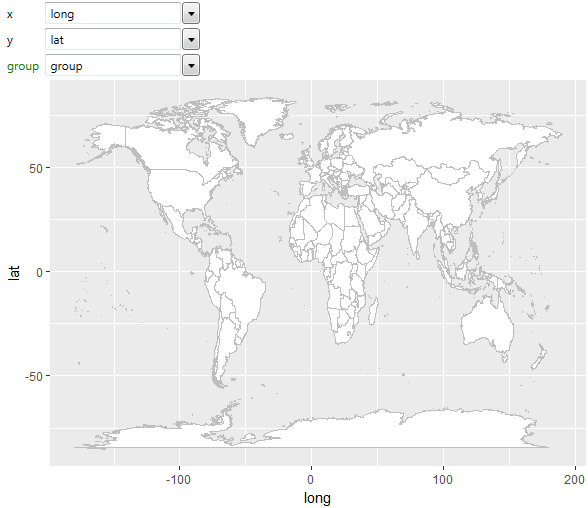
The program in fact does not know how to break down the individual
polygons and thus create only one. If you do not map other aesthetic
properties such as color, fill, linetype (for all polygons are used
the same aesthetic propreties), you can divide them according to the
group parameter. Subsequently, the program will recognize how to divide
coordinates into individual polygons and the final data visualization
will be similar to the one in the following figure.
The described property group can be used also for lines or other
spatial geometries. In the following chapters, you can learn more
about geometries that you can insert into your data visualizations.