Attach Dataset
For this chapter, I assume that you already know how to import data
into the program and how to preprocess them. These tasks are content
of chapters 4 and
5. Your data are imported and you
can use them in your data visualizations.
Imported data can be in graph displayed as geometry or statistical layer.
These layers you connect with data throught a property named data.
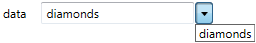
In this text-box you enter the name of your selected dataset. Beware of
the uppercase and lowercase letters use, because the R runtime is case
sensitive. The dataset name you don’t need to write manually, you
can use the combo-box after the text-box, in which are listed all datasets
imported into the Stagraph.
Since the Stagraph is visual interface on top of the R language (R GUI),
you can create your dataset also at this point in the form of R script.
Witing the R code in one-line text-box is not practical. Here you can
use one specific Stagraph feature. If you are focused in the text-box
(feature also works for other text-boxes in the Plot panel), press the
F11 key. After pressing this key, a simple help window displays
(Text Extender). The window contains only a simple code editor.
In this window, you can create your script on multiple lines with the
support of syntax highlithing and code autocompletion.
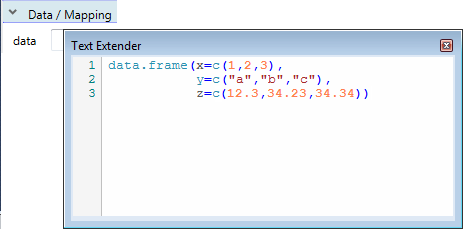
In displayed example we create in Text Extender window a new
small dataset (data.frame), which consists of three columns
(x, y and z) and three lines of values. Indivual
columns contain integer, character and numeric values.
If you want to put this code back into property text-box, press the
F11 key again and created code will be copied into the text-box.
If you close Text Extender through the Close button, changes
will be not applied to the text-box.
In this way, you can quickly and easily create a new dataset directly
in the main window on the fly. This approach is useful only if you
want to add into your plot an object (e.g. geometry) that is
based on a small number of values – e.g. plot annotation.
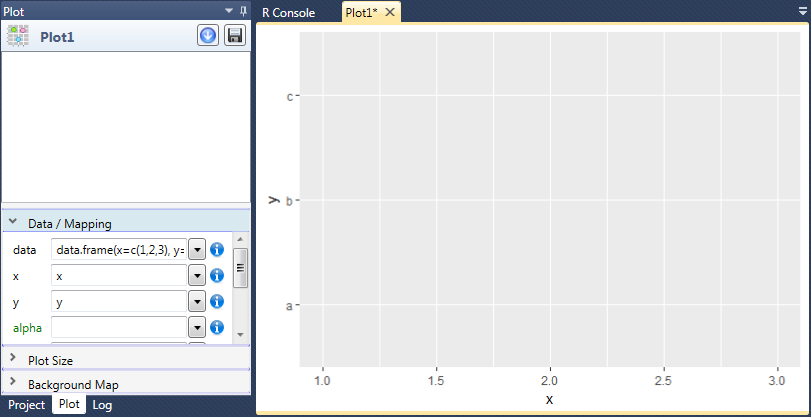
If you want to display your manually created dataset in plot, just specify
the column names as position aesthetics (x and y) and draw
the plot. In the following example, we have not added any geometry and
thus only an empty chart was created with defined position scales on the
basis of defined values.
If you already have created your dataset, it is often useful to quickly
filter out some values – display in plot only a part of values. If you
need to do this ad-hoc on a small dataset, you can filter the data
directly on the level of plot. If your dataset includes hundreds
of thounsands of rows, it is better to filter on the level of datasets
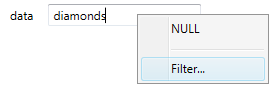
through the data preprocessing functions (chapter 5). If you want
to filter the data quickly at the plot level, after choosing the
dataset in combo-box right-click on the text-box and from the
context menu click on the Filter… menu item.
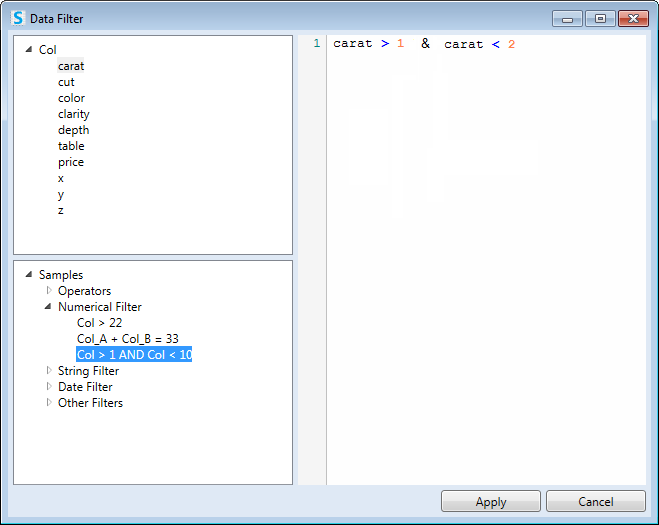
Consequently, a help window is displayed, in which you can filter your
data. The window consists of thre parts. On the left side are auxiliary
lists. In the top part are listed variables of your dataset. Under
this list are exmaples of filters that you can apply on your data
(numeric, string, date and specific filters). If you select any item
from these lists and press the Enter key, selected item will be
added to the filter editor on the right side. Here you can manualy edit
your filter.
The filter is written in the R language and you can use the full
functionality of this environment. In principle, filters listed as
exmaples are well enough for real use. The actual filter definition
is similar to the SQL specification (SQL code after the WHERE
operator). In this window you can define simple filter (e.g. values
from column A greater that X), as well as very complex combined filters
(such as the values in column A that are greater than 1 and values from
column B, greater than median of all values in column B).
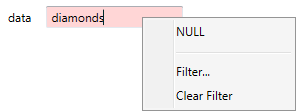
If you have your filter defined, press the Apply button. Subseqently,
your filters will be applied on selected dataset (only for the current
plot). Activated filter is in visual interface represented by a pink
background of the data text-box. For dataset filtering is in the
background used R function subset. If you want to disable your filter,
simply click in the context menu on the Clear Filter item.
Then will be used complete dataset for your data visualization.
Within the Stagraph you can set the data property on two levels,
at the level of plot and at the level of individual geometries and
statistical layers. If you set the dataset on the level of plot, you
don’t need to define the data property on the level of individual
layers, besause program uses dataset that has been defined on the plot
level. This is advantageous when you use one dataset in relation with
several geometries. On the contrary, if you want to use in your data
visualization multiple datasets, you define them individually for each layer.
If you have defined dataset that you want to use, you can continue
to the definition of individual aesthetics.