R Runtime
What is R
R is a "domain specific language" for data processing, statistical calculations and data visualization.
In a similar products the application core is commonly closed. On the other side, large and well known solutions
have an option of functionality extension via programming languages such as R or Python.
The Stagraph software is different. As the Stagraph core is directly used the R Runtime. This environment runs in the background.
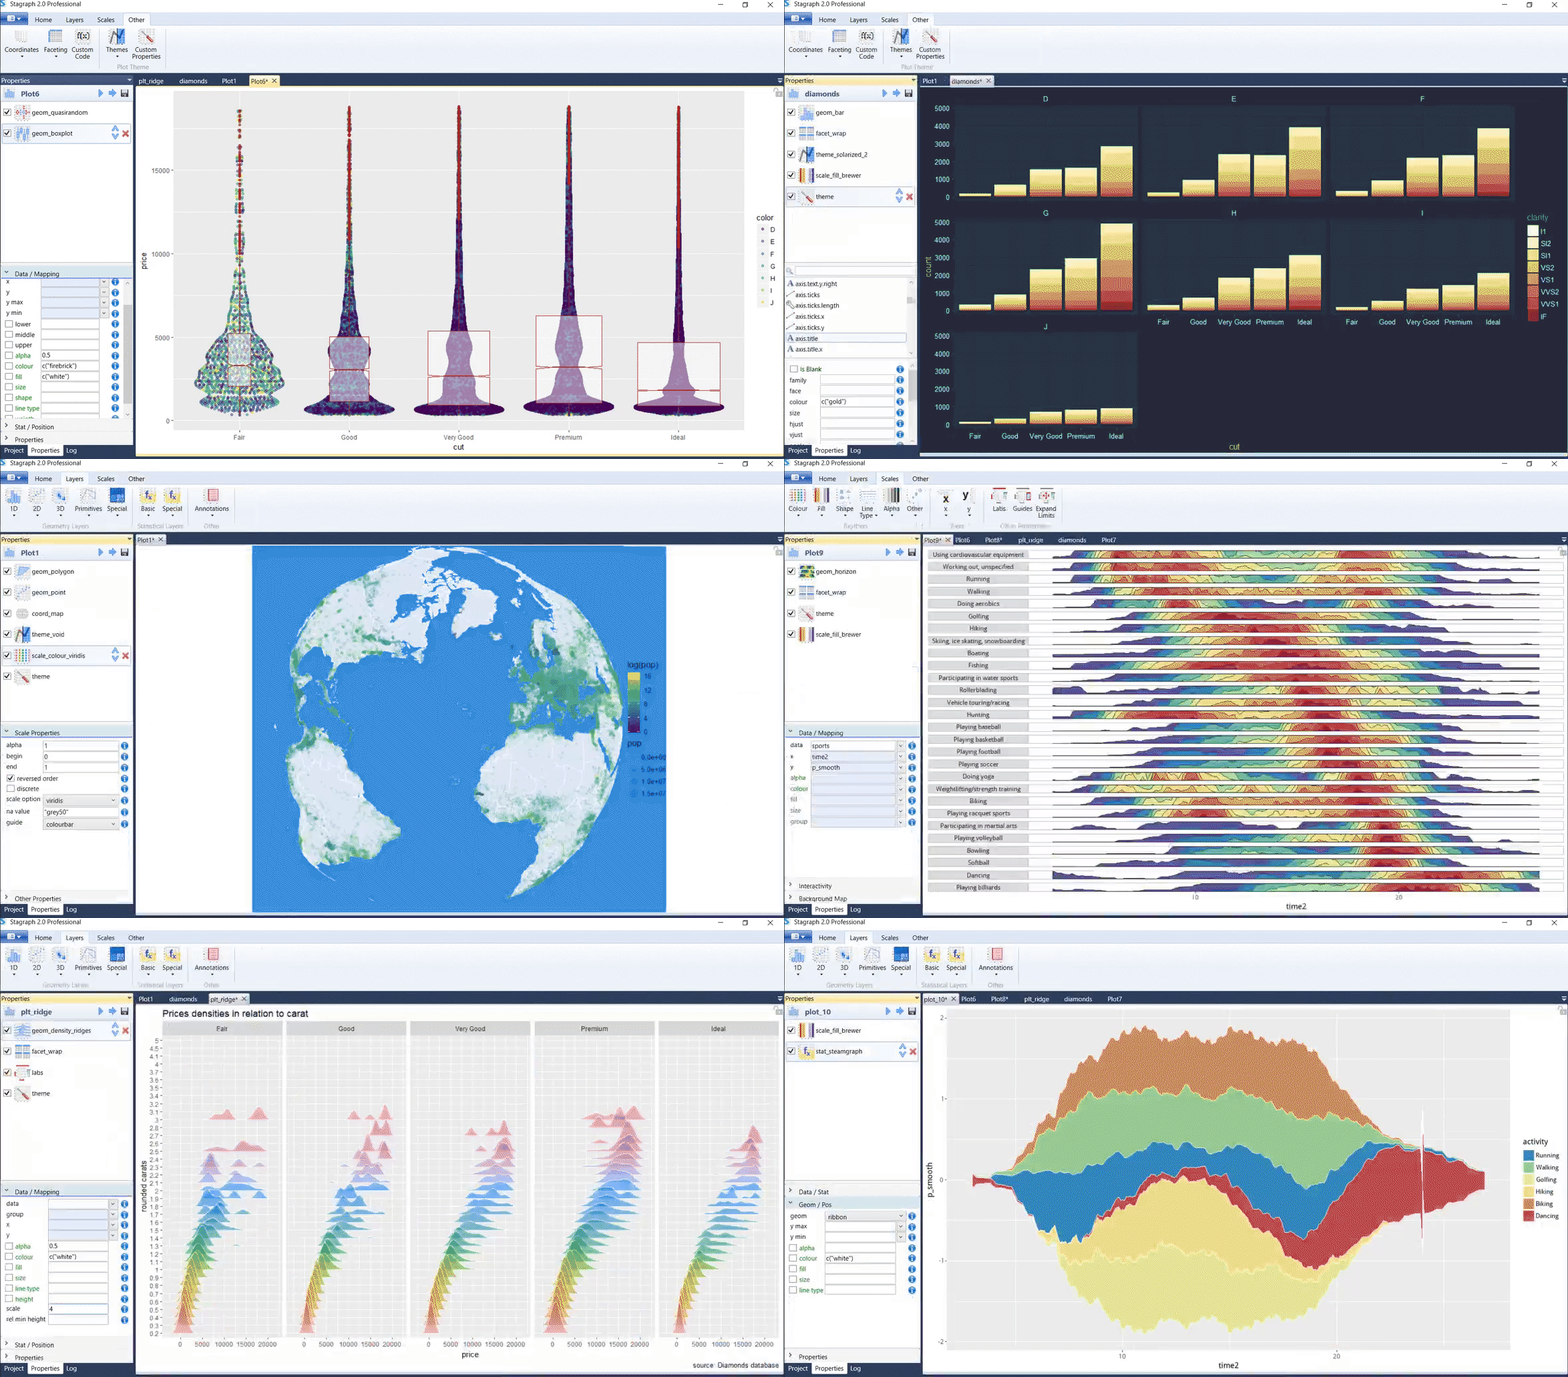
According to the user activities in visual interface, the program automatically creates R scripts and sends them into background R Console
and responds to the Console outputs.
This architecture has several very important advantages:
- Open Source core
- Access to complete functionality of the R language
- Fully documentable and reproducible approach for your analyzes - all your steps are documented as an executable R scripts
- Full separation of application interface and computing core
- You are not locked in closed (black-box) product
Other benefits of this architecture are described here.
IMPORTANT NOTICE:
If you install the R for Stagraph package, you install an Open Source distribution of R with preinstalled R packages.
Stagraph and R are two separate applications. Both are released
under a different license. Stagraph is a released as a Freemium application. R is an Open Source application released under the GPL license. After installation,
the R is located in the directory ../Program Files/R4Stagraph/. Everything in this directory is Open Source and you may to use it
in accordance with a GPL license (e.g., copy, modify, redistribute). Restriction is applied to the Stagraph application. The communication between Stagraph and R is over
the command line arguments, where Stagraph sends commands to the R application through the built-in interface (something like a "shell-editor" connection).
What is ggplot2
ggplot2 is one of thousands packages that extends the R language functionality.
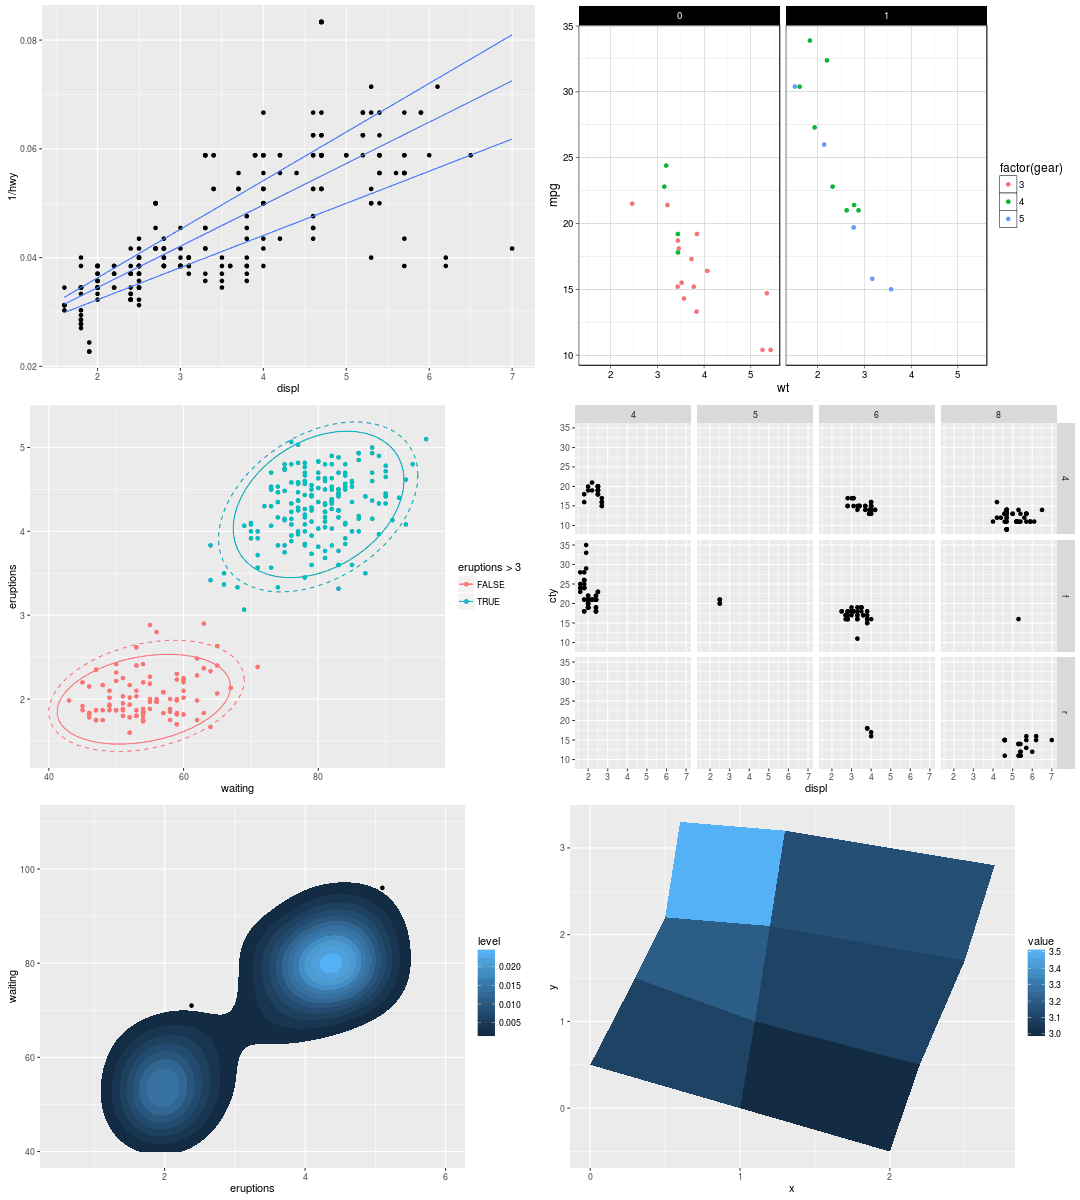
Using this package are created all data visualizations. ggplot2 is an excellent set of functions
for data visualization. The internal logic is based on the Grammar of Graphics. This makes it possible to
create very complex statistical graphics in several, very simple steps. Full documentation of this package
(along with examples) can be found at ggplot2.tidyverse.org.

Very well is the ggplot2 package described here.
ggplot2 package you can use inside the Stagraph without any programming experience.
However, if you know some basic R functions, your options are much greater.

R Language
R with all packages is an extensive environment that allows you to import (in to the computer memory) practically any type of data.
Imported data you can process and Plot. The basic R language documentation you can find here.
In Stagraph you can use R features through the visual interface or through an integrated console. The following video shows you how the integrated R console can be used in the Stagraph.
In the Editor you write your scripts and in the Output box are printed results from R Runtime. In addition, presented video contains examples of elementary R functions.
Stagraph - R Connection
As stated before, behind the Stagraph is running R Runtime as a background process.
Therefore, it is necessary to link the Stagraph with R.
Stagraph can be connected with R Runtime automatically if you use the R4Stagraph distibution.
This installation package includes R Runtime, along with all the necessary packages.
Stagraph & R Connection you can setup also manually.
This task is very simple.
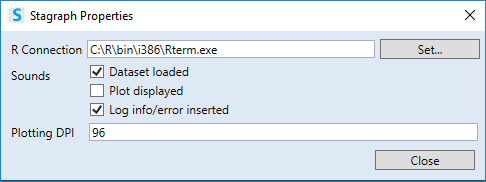
In the ribbon main menu click on the Properties item. In displayed dialog specify path to the Rterm.exe application. This
path you will set using the Open File Dialog that appears when you click on the Set…
button. Installed Rterm.exe can be found in the directory ...\Program Files\R\R-3.4.1\bin\i386\.

Finally, press the Close button and restart the Stagraph.
After rebooting, Stagraph will use custom R connection.
How to Prepare R Runtime
If you use an external R runtime it is necessary to have it prepared, because the Stagraph using numerous additional packages.
For full functionality, you must have to installed the following packages:
tidyverse, gridExtra, GGally, ggalt, ggbeeswarm, ggfittext, ggforce, ggridges, ggmap,
ggpubr, ggrepel, ggsci, ggsn, ggthemes, treemapify, ggmosaic, viridis, emojifont, ggpmisc,
qqplotr, devtools, geofacet, RODBC, sqldf, DT, rpivotTable, plotly, ggTimeSeries, ggalt,
ggforce, ggfittext
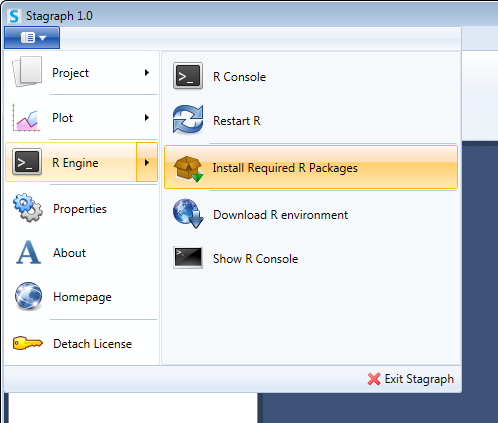
These packages can be installed automatically from the Stagraph - click on the
R Engine – Install Required R Packages. The program starts (in parallel) new R Runtime in which all the required packages will be downloaded
and installed.
For these steps, your computer must be connected to the Internet. A black
terminal window displays and you just have to wait until the window will be closed. When it closes,
all the packages are installed and you can use them in Stagraph.
