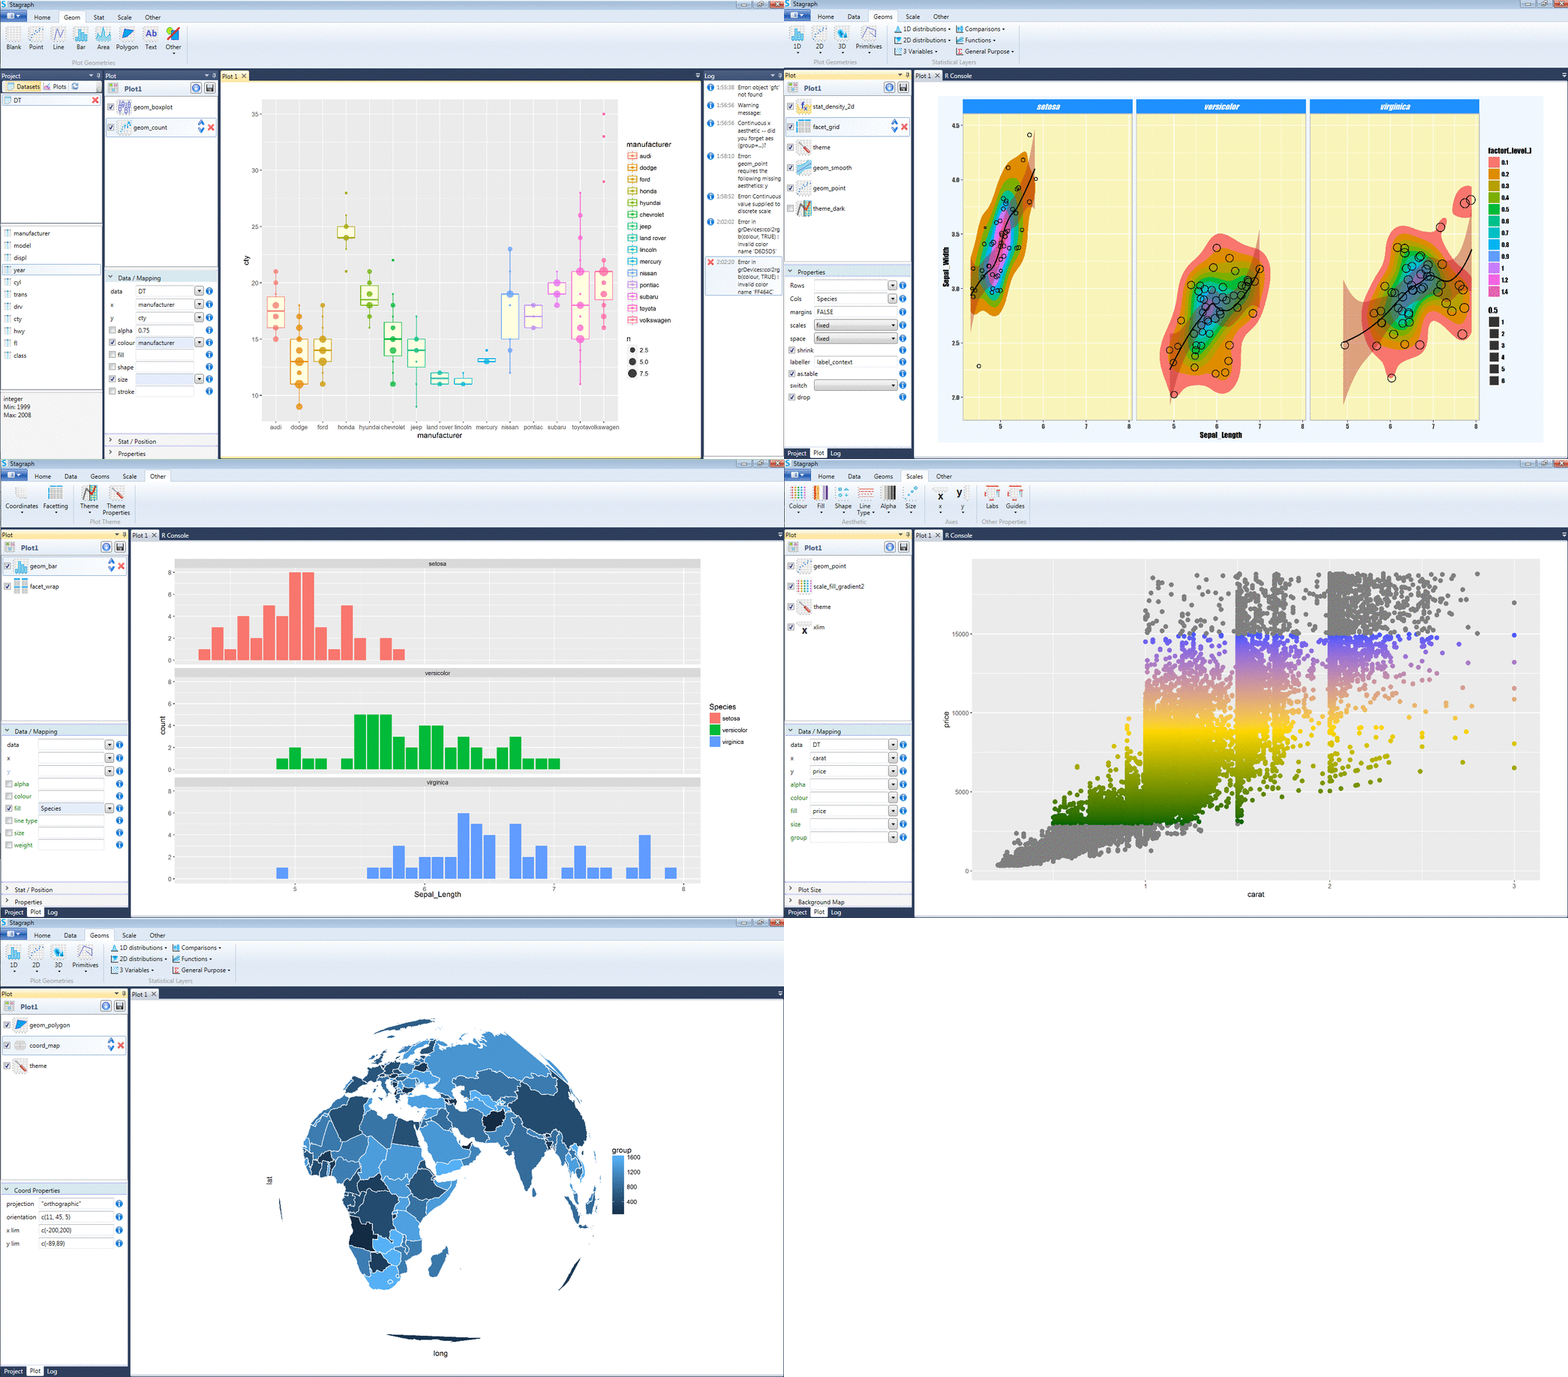
First screenshots of coming software for statistical graphics
Published on Friday, October 21, 2016 by Milos Gregor
The last months I am working intensively on Stagraph software development. This software solve import data from various sources (databases, files, web services, shape files …) their subsequent processing (cleaning, linking, selection, grouping, summarizing …) and final visualization.
As already stated, under the Stagraph visual interface is running R process, so the options of data manipulation and visualization are really extensive. The main task of this program is a fast and easy access to the described functions without the need for R scripts writing. Fundamental focus of program is data visualization and exploration – statistical graphics. With this program you can quickly and easily create quite complex types of visualizations in few simple steps.
Demo version will be available soon. This post provides some app screenshots that show statistical graphics options in the Stagraph software.

If you want to be informed about news (one email per 2-3 months) do not forget to subscribe.