 data_maps
See also: data_cities
If you visualize spatial data, it is often necessary to display them in relation to the real space. Therefore, we use some basic datasets, such as the World Map or database of World Cities. For this purpose, the Stagraph directly (in GUI) supports R package named maps. This package provides several datasets of spatial data. We can divide them into polygonal datasets of counties, states, regional entities and point datasets showing cities.
In this section, we’ll talk about datasets that displays countries, states and other regional entities. Usage options of spatial datasets are displayed in the following tutorial.
Overall, in the Stagraph you can find 7 integrated datasets:
| data_maps_world |
world map is imported from the Natural Earth project (the 1:50,000,000 resolution version). It replaces a much older version based on the CIA World Data Bank II data |
| data_map_france |
france database comes from the NUTS III (Tertiary Administrative Units of the European Community) database of the United Nations Environment Programme (UNEP) GRID-Geneva data sets |
| data_map_italy |
italy database comes from the NUTS III (Tertiary Administrative Units of the European Community) database of the United Nations Environment Programme (UNEP) GRID-Geneva data sets. |
| data_map_nz |
a map of New Zealand at a basic level of detail. The ‘"nz"’ database includes the 3 main Islands and 19 smaller coastal islands |
| data_map_usa |
a map of the United States mainland generated from US Department of the Census data |
| data_map_state |
map of the states of the United States mainland generated from US Department of the Census data |
| data_map_county |
counties of the United States mainland generated from US Department of the Census data |
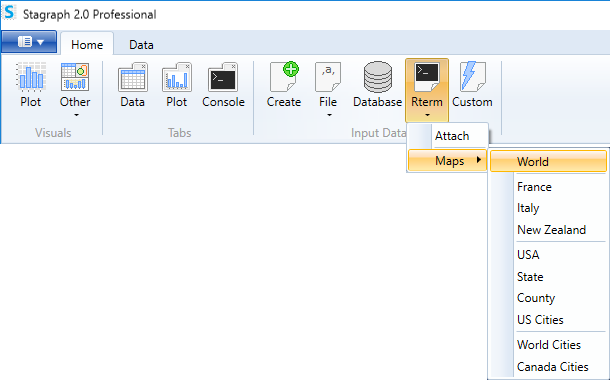
To access the described datasets, click on the Rterm button in the ribbon toolbar. In the menu that appears, you can choose selected dataset that you want to import.
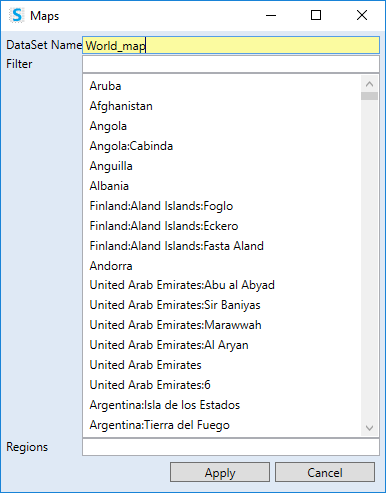
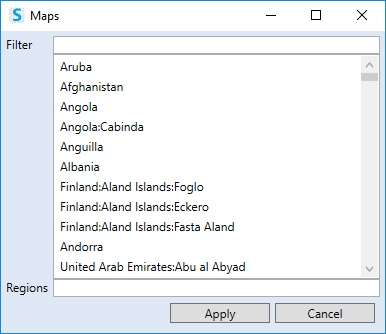
If you click on selected menu item, the dialog appears as in the following figure. In the first text-box you type the name of new dataset. Then you have to decide whether you want to import whole dataset or only selected regions. If you want to import the entire dataset (without filtering), only click on the Apply button and your dataset will be created.
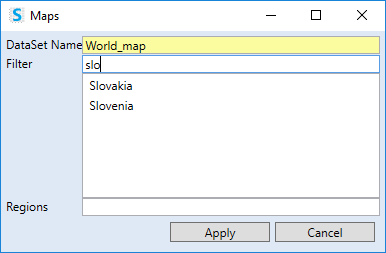
If you want to choose only selected regions - e.g. European countries, use the next text-box named Filter. This serves for quick search in dataset regions. The typed string is in real-time searched in the dataset. Found items are displayed in the list below the text-box. For example, if you type “slo" string, in the list will appear (if you use the World Map dataset) two countries - Slovakia and Slovenia.
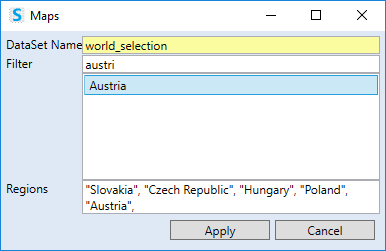
Selected regions you can import to new dataset by double-click. This action adding selected items from the list to the text-box below (Regions). The regions selected in this text-box will be imported into the new dataset by pressing the Apply button.
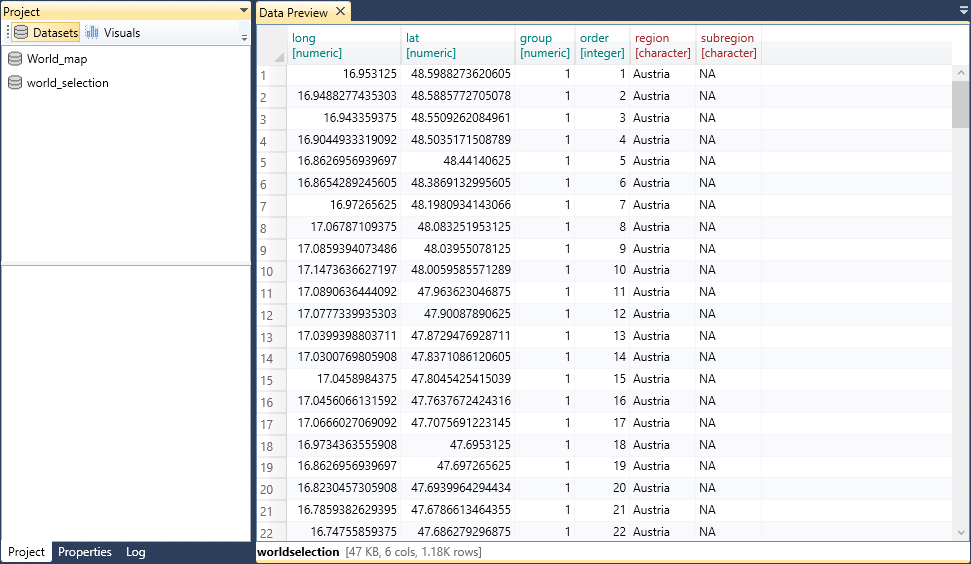
All map datasets have the same structure that consist of six variables. The example is shown in the following figure. In the table are individual polygons displayed in the “long form" - the coordinates are written on each other and the individual regions are identified through the variable group.
Ather import, you can work with the dataset in the Project Panel. If you click on the function data_maps, only one adjustable parameter is displayed - regions. You modify this parameter only if you want to import selected regions.
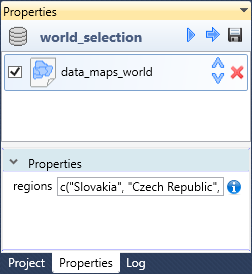
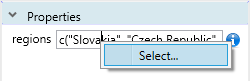
You can setup this property manually or using the built-in dialog that is accessible from the text-box contextual menu.
The dialog for regions selection will be displayed. The only difference is that you can no longer set the dataset name. Using the filter feature, you can customize the regions selection.
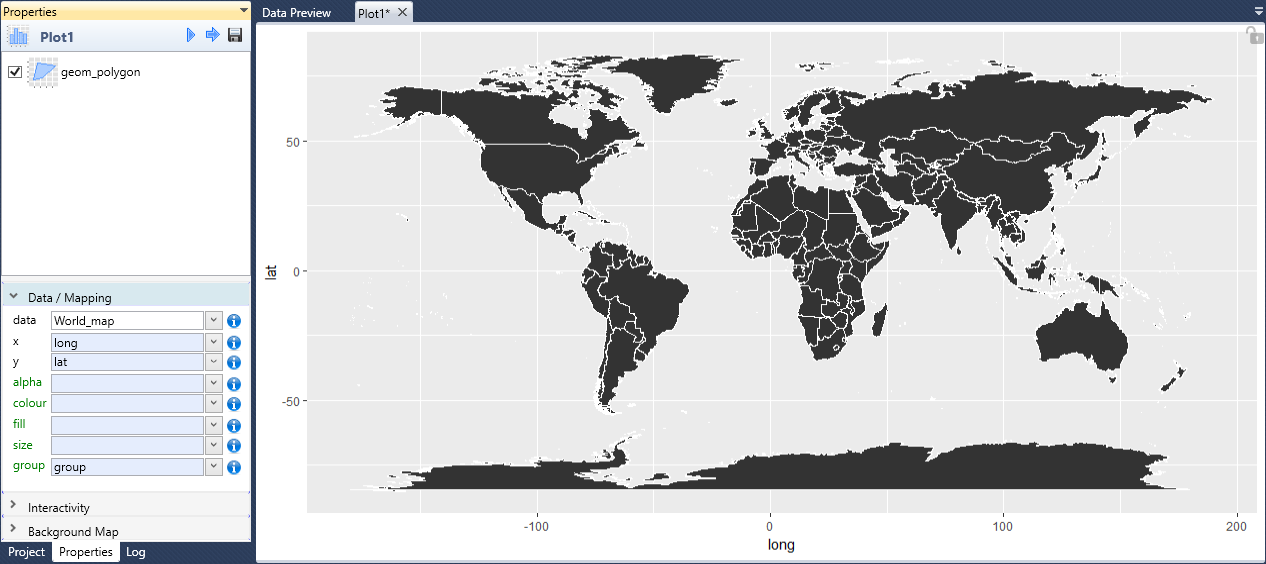
Imported data from the maps package you can use in your visualizations. We mostly use them as supporting layers for spatial data. The following image shows a dataset created by the data_map_world function (uses the entire dataset, without regions filtering).
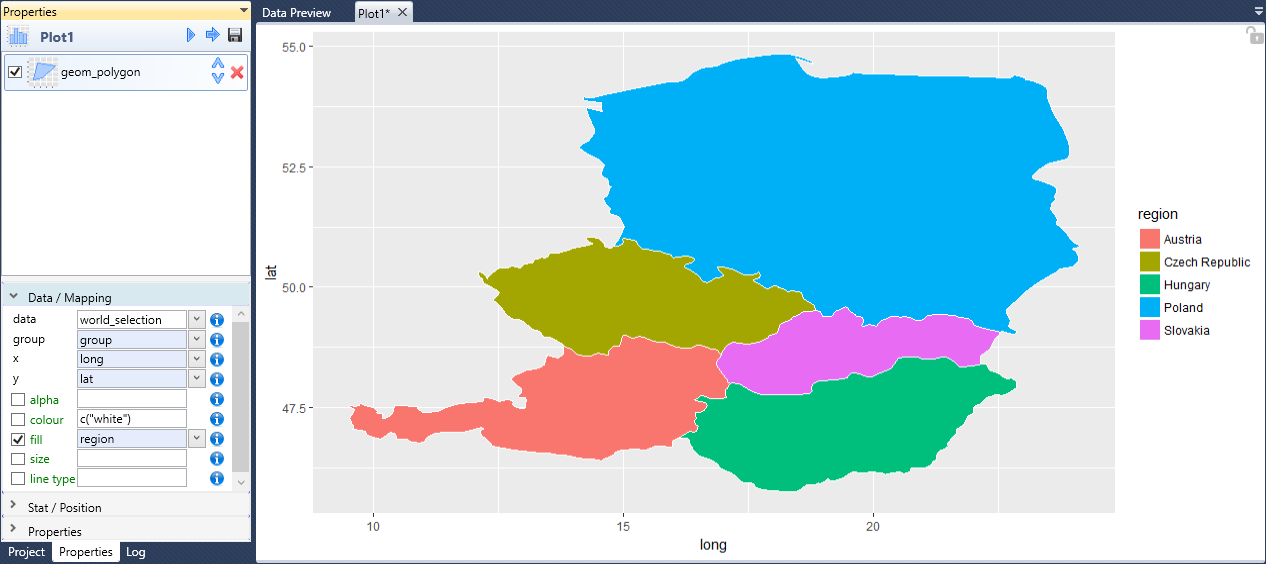
In the second example, we used the same function, but we selected 5 Central-European countries.
The following animation shows examples of map visualizations that uses other map datasets. From examples it is clear that they are not displayed in a geographic projection. Stagraph allows you to create visualizations with map projections as well. For information about this feature, see the functions coord_map and coord_quickmap.
For maps is in the Stagraph used an R package named maps. This package also contains other datasets, such as database of lakes or iso3166. Their complete list can be found in the package manual. Directly unsupported datasets you can also use in the Stagraph. You can import them into Stagraph via the data_custom function, using a small script:
suppressMessages(require(maps))

dataset_name <- map_data("iso3166")
In the previous script, iso3166 dataset is imported.