How to Color & Fill Aesthetics
The statistical graphics often work with aesthetic parameters color
and fill. For geometry that you put into a chart, you can define one
of two color properties. If it is a simple object (e.g. geom_line)
you can define only a single color. If the object is more comlex
(e.g. geom_boxplot, geom_polygon), you can set individually the border
line color (color) and the color of inner surface (fill). As with all
aesthetic properties, color aesthetic can be maped or set.
The color aestheric setup is relatively simple. The aes check-box leave
in the unchecked state and into the text-box put the color value. Color
can be defined in two ways. You can define color by its name (string,
e.g. "red") or by RGB coding. Since this entry is not user friendly, you
can use the features that appear in the context-menu if you right-click
on the text-box area.
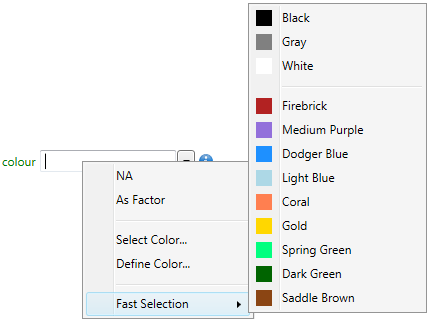
Using the context-menu, you can set the color using multiple tools. You
can choose one of the predefined colors under the Fast Selection item.
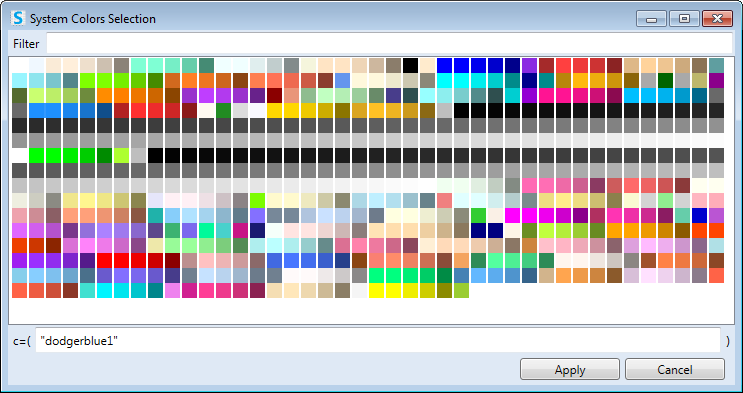
Then you can choose one of the system colors, if you click on the Select
Color… item. You’ll see a dialog of all available colors. After double-click
on selected, its name is inserted into the text-box below the list of colors.
If necessary, you can select in dialog multiple colors (e.g. if you choose
custom colors for color scale). The last feature of dialog is filter text-box
above the colors list. If you write some color (e.g. "blue"), you will see
only colors that inclue in their name typed string (dodgerblue, steelblue …).
After clicking the Apply button, selected color is inserted into the aesthetic
property text-box.
The second way to the color definition is its specification using the
RGB channels. Help dialog for color definition is displayed when you
click on the Define Color… item in context-menu.
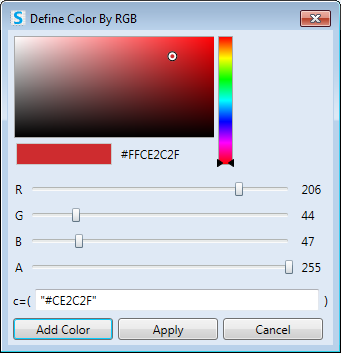
In this dialog, you can define the color based on the values of
RGB channels. Aphla channel can not be defined, because Aphla
is in Stagraph defined as an individual aesthetic parameter.
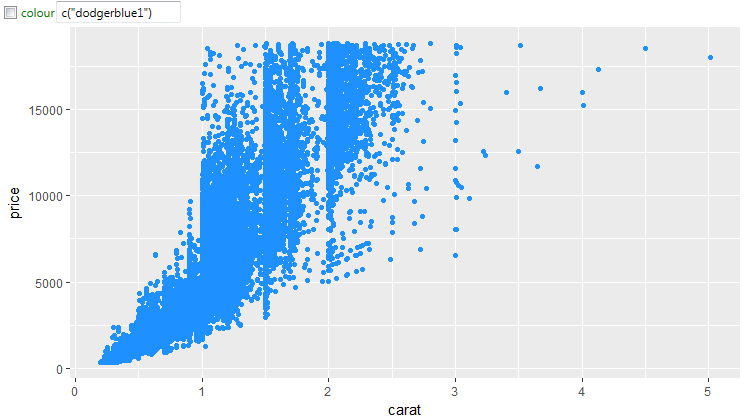
In the following, we will show how you can set the color and
fill parameter. The first example shows a graph in which we
set the points color to dodgerblue. If you want to set the
color property, leave the aes check-box unchecked.
If you are using a geometry that allows you to define the fill
parameter, you can adjust individually both properties. In the
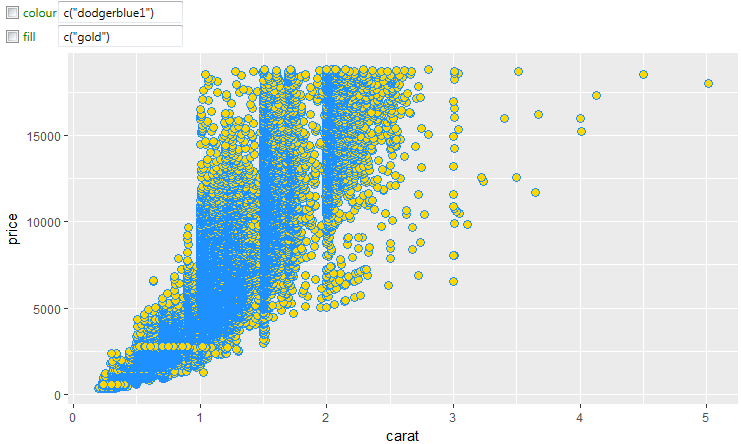
following example, we define the point border color as dodgerblue
and fill color as gold.
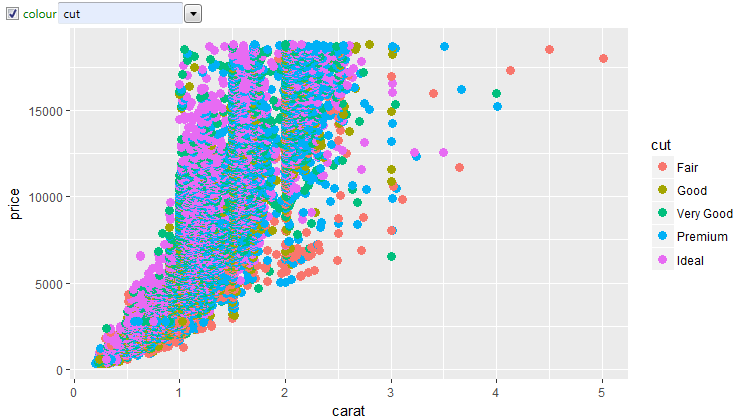
If you want to map color to selected variable from the dataset,
set the aes check-box to checked and from the displayed combo-box
choose variable that you want to map. In the following example,
we map the color aesthetic to string variable and thus the color
scale is designed automatically as categorical.
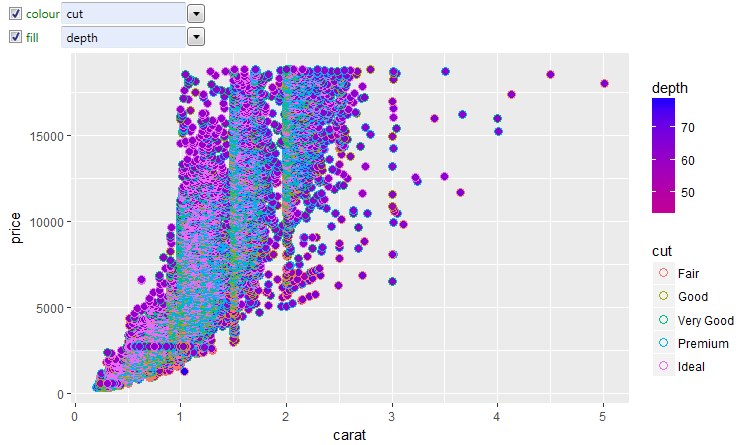
If you use a geometry that allows defining also the fill property,
you can map both aesthetics to variables from the dataset. In the
following figure, we map the color property to a discrete variable
cut and fill property to continuous variable named depth.
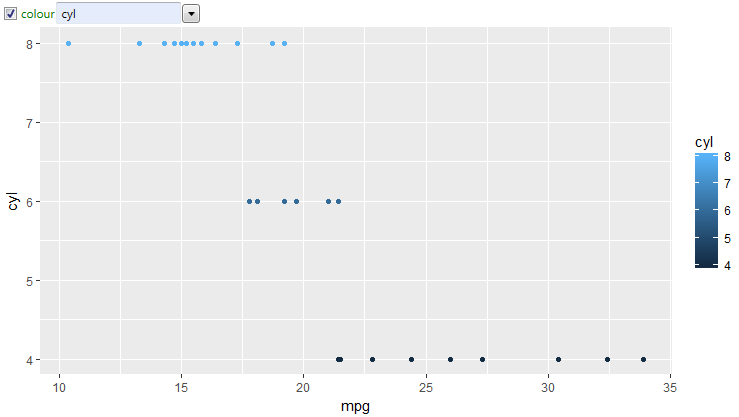
As in the case of other aesthetic properties, you can use for color
mapping combination of multiple variables or its transformation. As
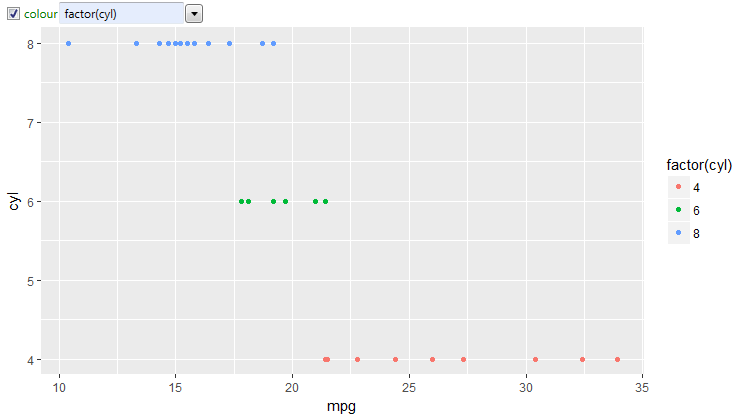
an example, we use the mtcars dataset. In the beginning we map color
to variable named cyl. This variable is integer and program automatically
creates continual color scale.
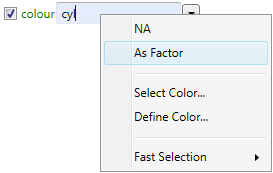
If you want to transform this color scale to categorical, you
need to format values before the use – convert integer values
to factors. For this purpose, you can use R function factor.
You can write this function manually or automatically, by click
on the As Factor item in context-menu.
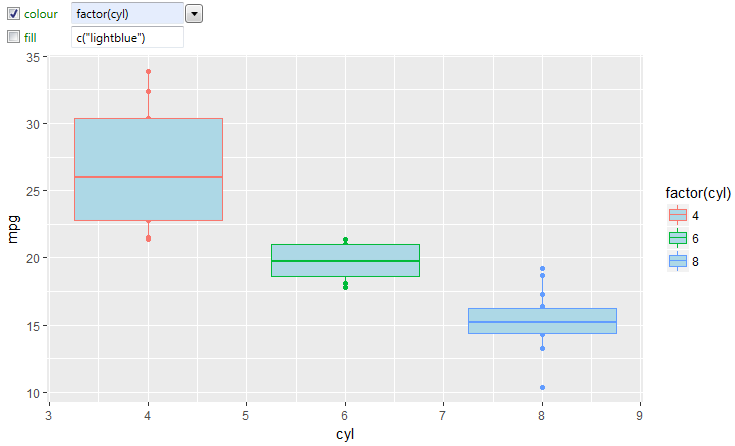
Then program works with defined variable as with the categorical values
and therefore the color scale will be categorical.
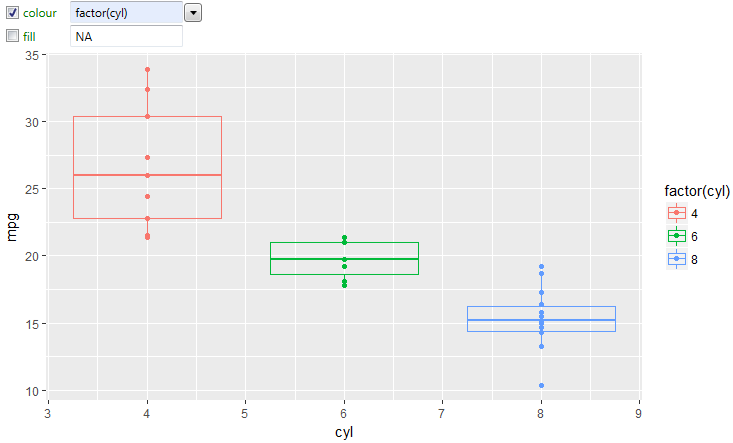
Finally, in the context-menu remains one more item – NA. You set
this value if you don’t want to see the color at all. An example
would be the geom_boxplot, where you can set color and fill property.
In some cases, it may be usefull to display boxplots without
the fill (display only the outline). For this case, set the
fill property to NA (without quotes). Subsequently, the boxplots
will be drawn without filling. If you set as NA both aesthetic
properties (color and fill), selected geometry will not be rendered.
The next chapter deals with the transparency definition through
the Alpha aesthetic property.