Aesthetics
Your data are in data visualization displayed by aesthetic properties that
are applied on geometries. As the most used aestetics can be listed color,
position in space, size, transparency and shape. Aesthetic parameters can
be set (e.g. red color, 50% transparency or dash line type) or mapped (set
the color according to the variable in dataset). In the following subsections,
will be indroduced individual aesthetical properties that you can use in
Stagraph. In Stagraph you can work with the following aestetics:
Using these aesthetics you can set visual presentation of individual
geometries in your data visualization. For example, scatterplot is
defined as a point geometry which is represented by the position in
space (position aesthetics), color, transparency, size and shape type.
These aesthetics may take the default values or they can be adjusted
according to your needs.
Aesthetic properties can be set for the entire data visualization
or for individual geometry layers. If you set aesthetics on the level
of entire plot, all inserted geometry layers will use these properties,
unless you set them on the level of layer. If you set them at the
geometry level, their properties will be used only within a given
geometry. The basic logic of aesthetic definition will be described
on the color aesthetic.
We have created data visualization. We used a sample dataset of
diamonds from ggplot2 package that is presented by point geometry
(geom_point). Aesthetic properties are listed in the Data / Mapping
section of properties in Plot Panel. At first, we defined the position
aesthetic (x and y) – relationship between carat and price of diamonds.
Individual records from dataset are presented as points.
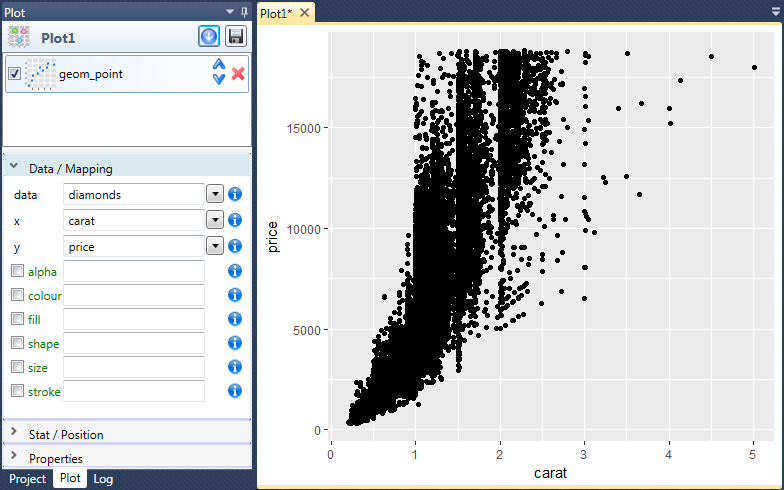
By default, these points are presented in black color. Other adjustable
aesthetics are in Plot Panel marked by green font color. These aesthetics
includes also colour aesthetic that we use as the example.
Overall, you can define color aesthetic by three values through two methods.
Aesthetic parameter can be set or mapped. If you set them, you define the
property regardless of the data and aesthetic defines only a visual
presentation. If you map aesthetic property to data, the property represents
also other visually coded information.
If you want to set the aesthetic parameter, you can define it manually
or you can use the tools and features hidden in the context menu.
Specification of these features is decribed in the following chapters.
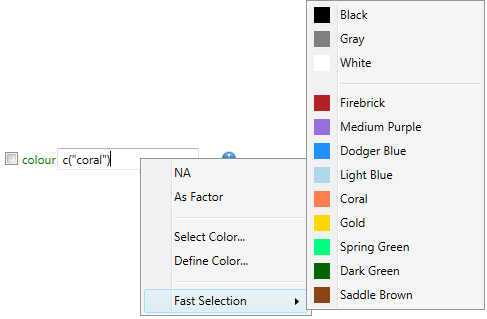
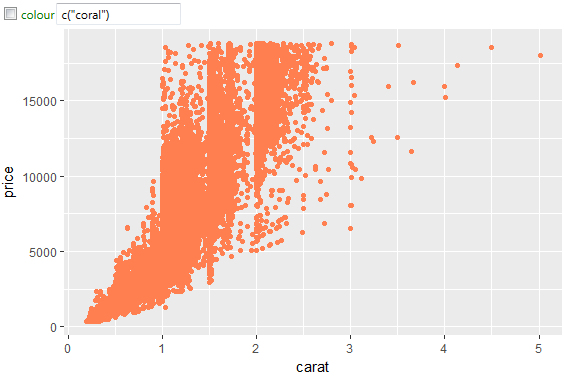
If you want set the color, leave the check-box before the aesthetic
label (aes check-box) in the unchecked state. Then you can set the
color according to your needs. In the following example, we set the
color to "Coral". After next rendering, these values will be reflected
in your data visualization.
If you want to display additional information in aesthetic, you must
map the variable from dataset to this property. If you want to map
color, it is necessary to set the aes check-box (before aesthetic
label) to TRUE. If you map this property, you can proceed in two ways.
You can map color to a value or map to variable from dataset. The
difference with the previous case (aesthetic setting) is that in the
legend appears information coded as a color.
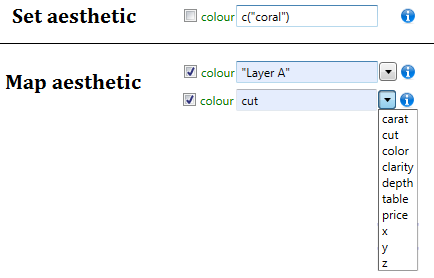
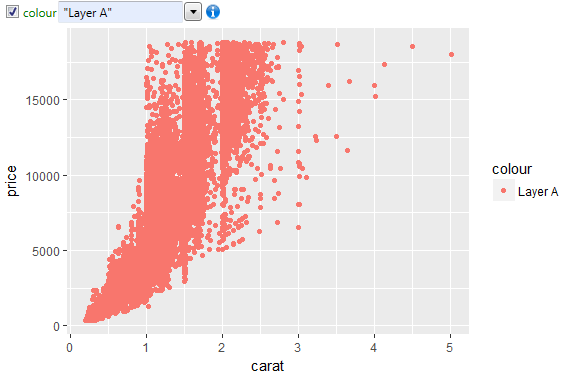
If you want to create charts like in Excel (one geometry layer –
one dataset – one item legend), set the aes check-box to checked
and in the text-box write the name of layer. This name must be
enclosed in quotes. By this way defined name appears in the legend
as color item. Geometry will have unique (default) color and will
be displayed as item in the legend. Layer color and character of
legend you can change using the scale object.
Finally, the last option remains – color definition by variable
from dataset. If you set aes check-box to checked state, a combo-box
appears after the text-box. From this combo-box you can choose
dataset variable that will be mapped as color aesthetic. If you
use dateset variable name, its name is not enclosed in quotes.
If the value in aesthetic property is not enclosed by quotation
marks, the program automatically searches typed string as the
dataset variable name. In the following example, we define color
according to the cut variable in the diamond dataset.
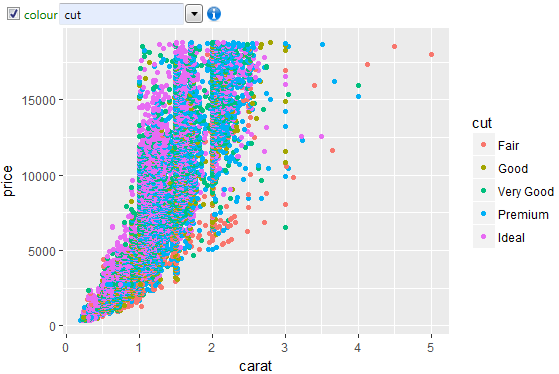
The program will automatically use the default color scale and also
automatically generates a legend. Color scale and legend character
you can edit using the objects and functions of Color Scales group
(scale_colour_discrete, scale_colour_continuous, e.t.c.).
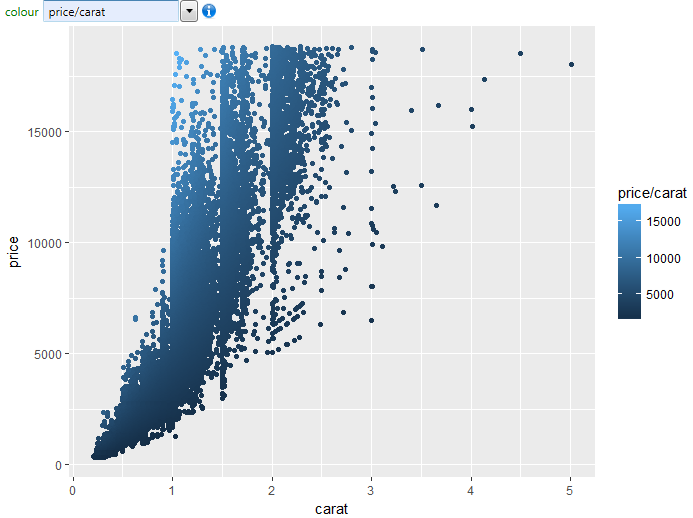
At this point, the program has one very powerfull and effective feature.
The color aesthetic can be also based on multiple variables. You can
create and use any function (in R language) that combines multiple variables
into one. For example, the color can be defined as a relationship between
the price and carat variable. In this case, we enter a simple equation:
price/carat
Subsequently, defined new variable is calculated on the fly and used for
color scale definition. Typed equation is displayed automatically as title of legend.
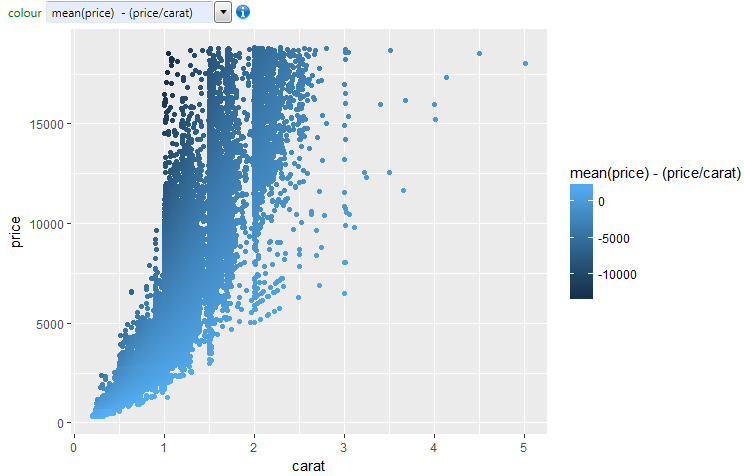
In addition to the simple equations you can also create more complex
equations, such as from the average diamods price deducted value of
the ratio between diamond price and carat. The following figure shows
the result of described equation.
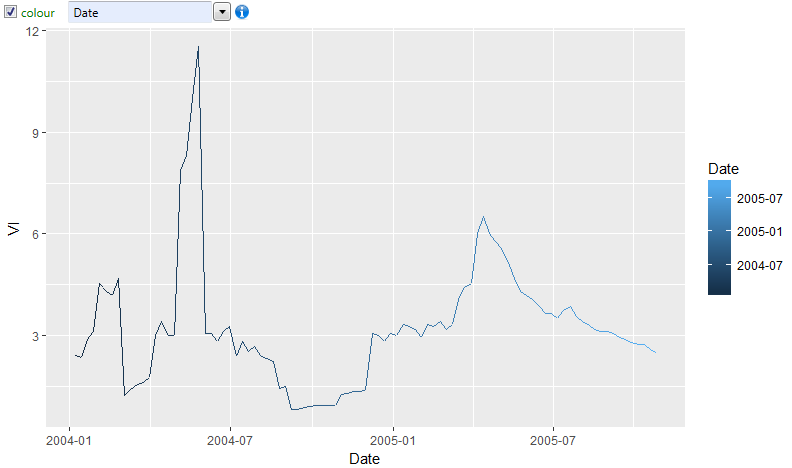
Another example of color aesthetic definition is shown in the following
figure. In this case, we Plot time-series of river dischages and
the line color is based on the date variable. Since the date is continuous
value, color scale is also continuous.
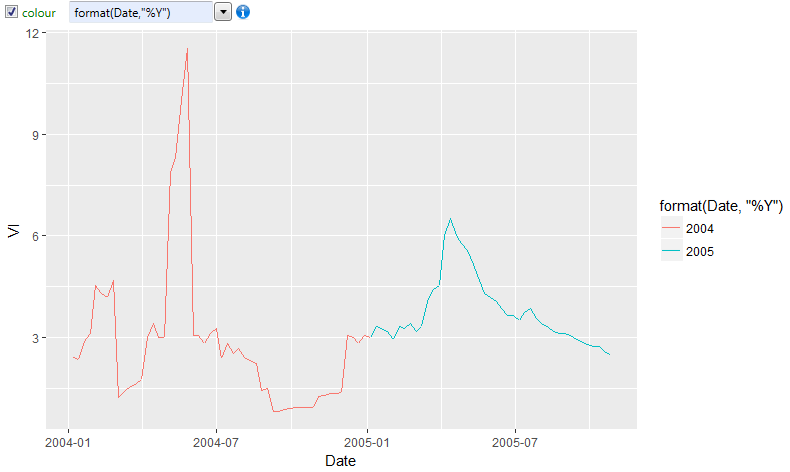
What if we want to define the line color as categorical value and display
it in the way that every year in time-series is defined by a unique discrete
color? This can be done simply by date reformatting using the R
function format. Its definition is as follows:
format(Date, “%Y”)
This function takes the values of Date variable from dataset and retrieves
year value and returns it as character. Subsequently, this value is used for
color scale definition. The result is shown in the following figure. From
the data visualization we can see that there were only two discrete colors,
because the time-series is from two years. Used colors can be later changed
by functions from the Color Scales group (scale_color_discrete).
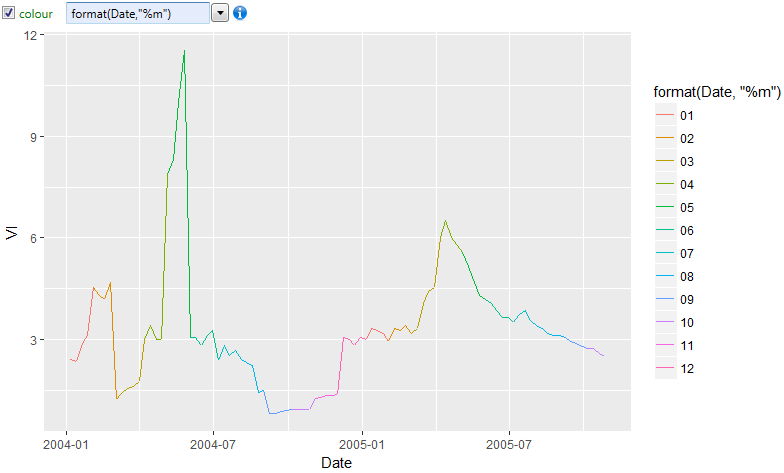
In the next example, we will use the same dataset, but the color
is defined categorically according to month of the year. In this
case, we only change one parmater of the format function ("%m"
instead of "%Y").
format(Date,"%m")
The result is shown in the following figure. The logic of aesthetics
parameter definition is quite simple and its functionality can be extended
using the functions of R language.
If you are using selected types of geometries (e.g. geom_density,
geom_boxplot, geom_hex), program before rendering transforms your
data. An example would be geom_boxplot. In this case, variables that
are defined as position aesthetics (x and y) are transformed into a
form that allows their display. More about the statistical data
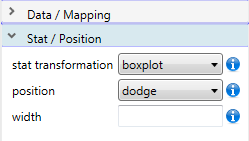
transformations will be in a separate chapter later. If the statistical
transformation is defined (section Stat / Position in the Plot Panel),
your data is automatically transformed on the fly before the visualization.
Based on the selected statistical transformation, in the list of available
dataset variables (aes combo-boxes) are autoamtically added another
variables that arise during plot rendering. Its nature and number is
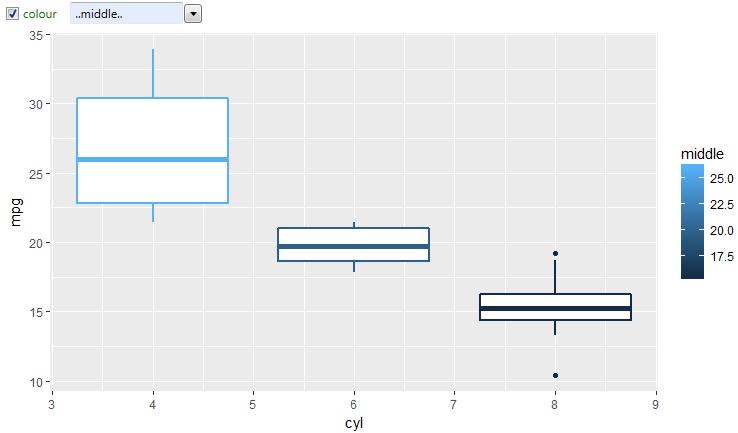
dependent on the selected statistical transformation. If you use statistical
transformatin "boxplot", into the lists are added precomputed variables
width, ymin, lower, notchlower, middle, notchupper, upper and ymax. These
precomputed variables are marked with two dots before and after their names.
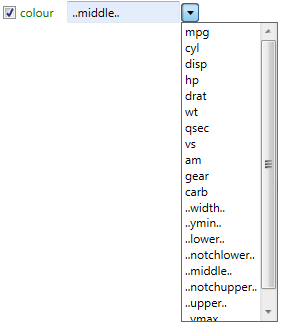
You can work with them as with other variables from the dataset. They can
be combined or formatted. The following figure shows the boxplots in which
the color aesthetic is based on median value that is precomputed (variable
..middle..). More about the statistical data transformation on the plot
level will be shown in a separate chapter (Stat Property).
The following chapters are focused on detailed definition of invidual
aesthetics properties and options of their definition.