How to Position Aesthetics
Basic aesthetic properties that you use in Stagraph are position
properties of the selected geometry in a 2D space. This position
can be defined by parameters x and y. In some cases, it may be even
more of these parameters. An example would be geom_boxplot. This
geometry can be defined by the parameters x and y (program automatically
calculates statistical variables) or by parameters x, ymin, lower,
middle, upper and ymax (set direct varaibles from the dataset). More
about these specific cases will be mentioned in sections for
individual geometries.
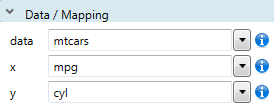
If you set in Plot Panel as data property the dataset that you use,
you can choose from aes combo-boxes variables that you want to map
as the position aesthetics. As with other aesthetic properties, you
can use selected variable from dataset or its combination (as equation
in R language). The first example uses mtcars dataset and as position
aesthetics are used variables mpg and cyl.

Program automatically detects the data type of variable and creates
continuous (numeric values, integer, date, time, datetime) or categorical
scale (string). Sometimes, it may happen that the values you use has
continuous nature (e.g. integer), but you want to use them as categorical
variable. As an example, we can use previous figure, where the values on Y
axis are integers. Program automatically creates for them continual scale.
In our example, the dataset does not contain values 5 and 7 and on the scale
they take up an unnecessaey space. In this case it would be appropriate to
use them as categorical values and display only those that occurred in the
dataset. This transformation can be accomplished easily. Just enclose the
variable in parentheses and write before the R function factor. This
function transforms continual values to categorical and displays them in
plot using the categorical scale.

Now, on the axis are not longer displayed values 5 and 7. Then you
can, for example, change their order using the function scale_y_discrete.
Further, you can define the position as a function of several dataset
variables. You can, for example, define Y axis as the ratio between
variables disp and cyl. The position property is defined as follows:
disp / cyl
If you want use the logarithm of X variable, just use the following record:
log(mpg)
The result of such position is in the following figure.
Every time you choose varialble from the aes combo-box, the current
value in the text-box will be overwritten by the new value. If you
want to pass a value to text-box at the end of current content, hold
the SHIFT key at the combo-box selection.

Another example shows how you can define your graph as 1D
visualization. One axis (e.g. X) is defined by variable from
the dataset. The second is defined as a single value. You can
use value in numeric or string format (enclosed in quotation
marks). After drawing, points are on the Y axis located on one
line. Then you can use the Position Scales function to hide
the title and marker of Y axis and your grah will be visually
indentical to the classic 1D plot.
