 geom_ribbon
Ribbon plot. Each x value is related with one ymax and ymin value.
Aesthetics
Other Properties
This geometry does not contain other properties.
Similar Geometries
geom_area,
geom_line,
geom_step
Description and Details
Using the described geometry, you can insert a simple geometric object
into your data visualization – ribbon that is defined by positional aesthetic properties x, ymin and ymax.
You can find this geometry in the ribbon toolbar tab Layers,
under the Primitives button.

geom_ribbon geometry is often used to display a range of values
along a continual values on X axis – for example, a range of
measurement errors. Its position is defined by the parameters x,
ymin and ymax. The example shows the following picture. Described
geometry is not bounded at the bottom by a zero values, like the
geom_area geometry.
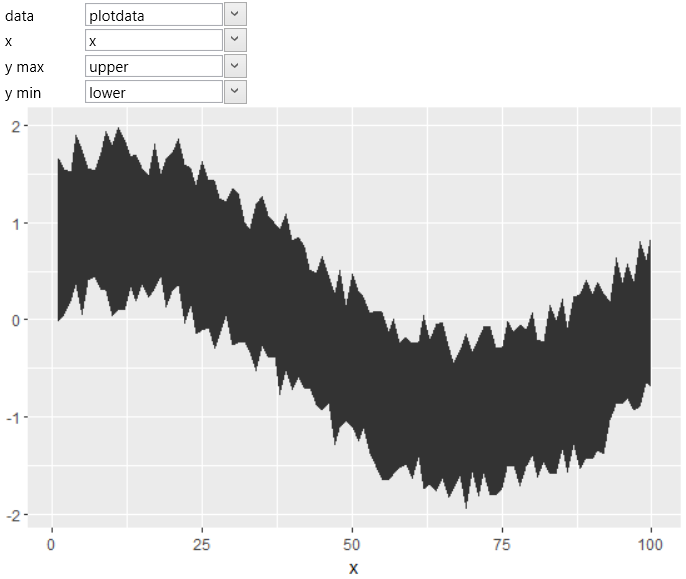
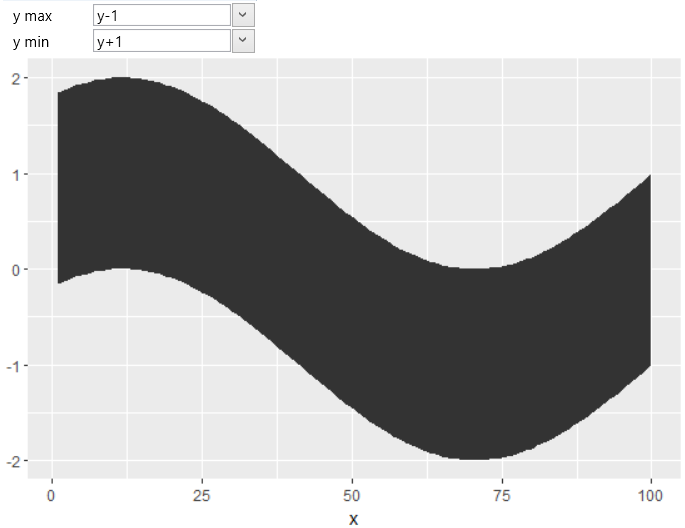
You can map variables from the dataset directly to ymin and ymax
properties. The second option is to map both parameters to one
variable that will be adjusted – for example, you add (for ymax)
and subtract (for ymin) selected constant values.
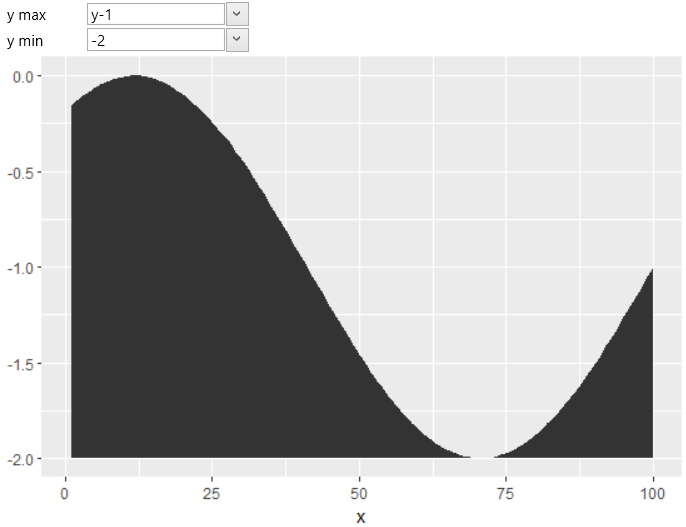
You can also modify geom_ribbon to look like geom_area geometry.
You map dataset variable to the ymax parameter and define ymin
as a constant numeric value.
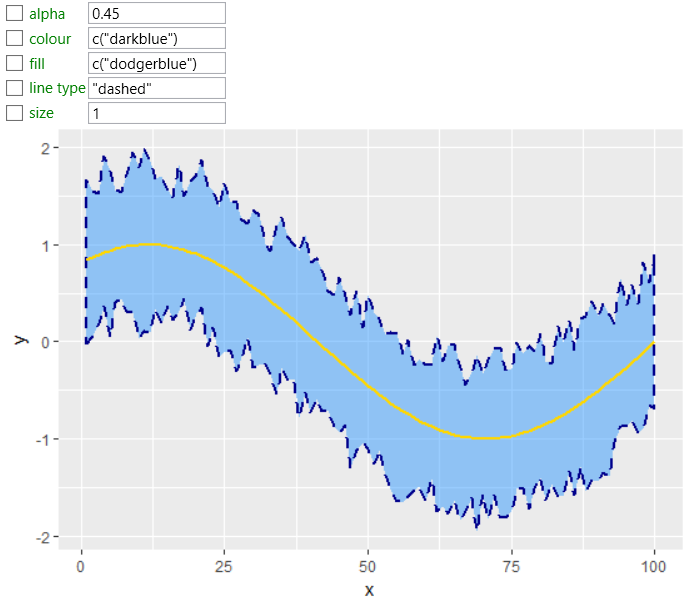
As with other geometries, you can define a number of aesthetic
properties. In the following picture, we changed the background
color and color of border lines, line type and thickness. In
addition, we added the second geom_line geometry.
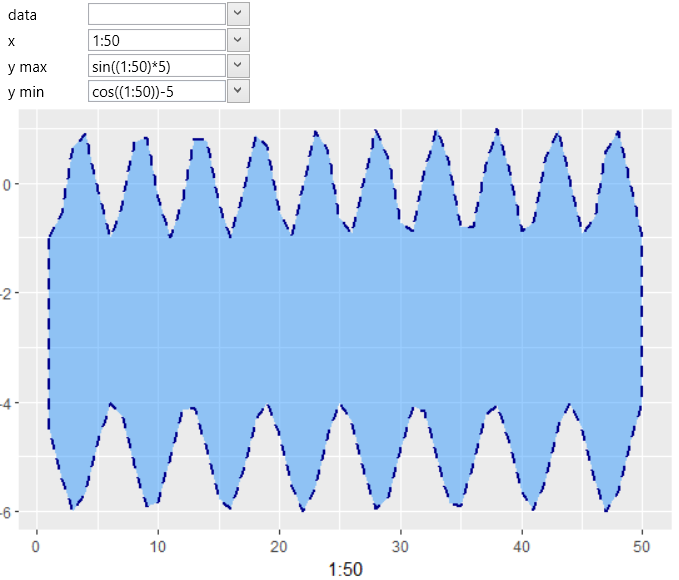
If we insert geom_ribbon into the data visualization, we mostly map
its position parameters to variables from imported dataset. However,
these position parameters can also be defined using R functions. In
this case, we leave the data parameter blank and the positional
parameters (x, ymin and ymax) are defined as functions. In the
following example, we defined x parameter by a function – 1:50
that generates numerical vector ranging from 1 to 50 in step 1.
Subsequently, it is necessary to create functions for the ymin
and ymax parameters, resulting in a numerical vector with the
same number of values. We also created a numerical vector using
function 1:50 and these values were transformed using sin and cos
functions and shifted using constant values. The result is shown
in the following picture.
The geom_ribbon geometry is useful if we display a range of values
along a continuous X axis. Similar geometry is geom_area, but we
display only one variable (ymax) on the Y axis and the ymin values
are fixed to 0. Similarly, we define the positional characteristics
for geom_line and geom_step geometries.