 geom_vline
Reference line defined by X intercept. Useful for annotating plots.
Aesthetics
| x intercept |
parameter that control the position of the line |
| alpha,
colour,
line type,
size |
classic aesthetics properties |
Other Properties
This geometry does not contain other properties.
Similar Geometries
geom_line,
geom_hline,
geom_abline,
geom_path,
geom_smooth
Description and Details
Using the described geometry, you can insert a simple geometric
object into your data visualization – a line defined by position
on the X axis. You can find this geometry in the ribbon toolbar
tab Layers, under the Primitives button.
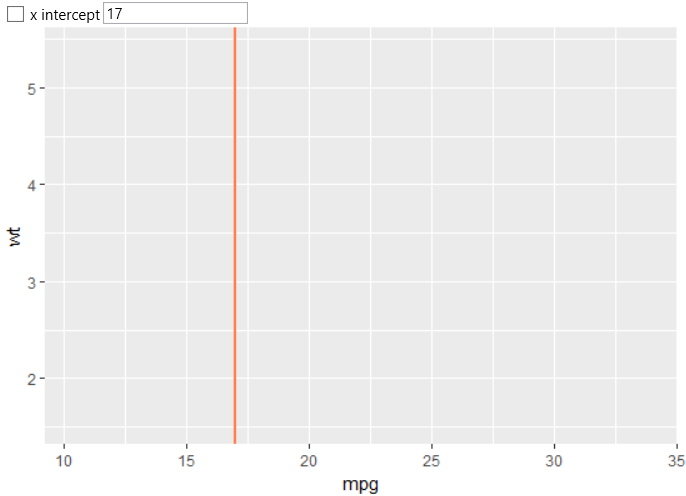
We define the geom_vline geometric object using the position
property x intercept, which determines the position of the
vertical line in the graph. The example is shown in the
following figure. We created one vertical line on the X
coordinate 17.
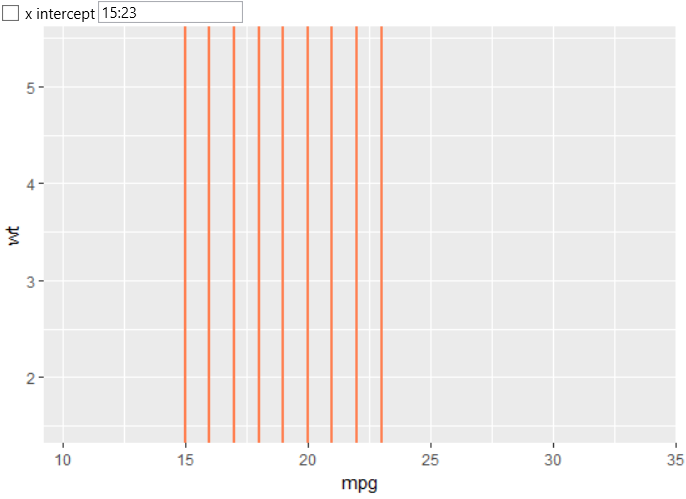
You can define multiple lines with one geom_vline object.
If you want to define lines in step of 1 between two values,
you can define this in the form 15:23. This entry generates
a line between coordinates 15 and 23 in increments of 1.
The result is shown in the following figure.
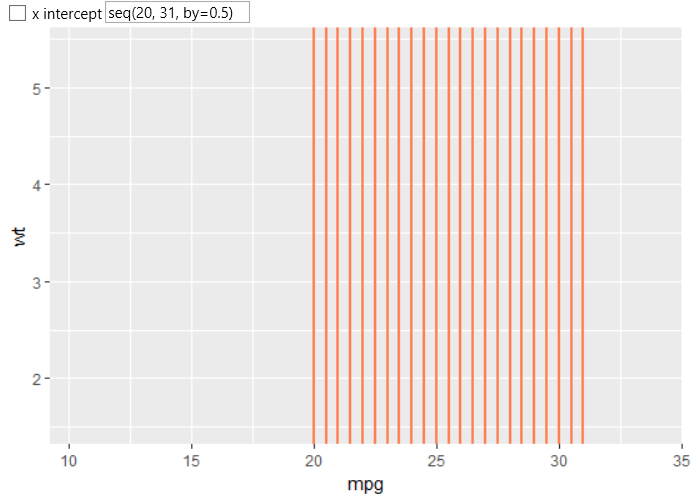
Another way of definition is possible with the selected R function.
An example may be the seq function. The following figure shows an
example of creating vertical lines at coordinates from 20 to 31 in
step 0.5.
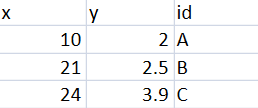
In addition to direct definition, you can define vertical lines
by mapping them to an imported dataset. For example, we use a
dataset whose structure is shown in the following figure.
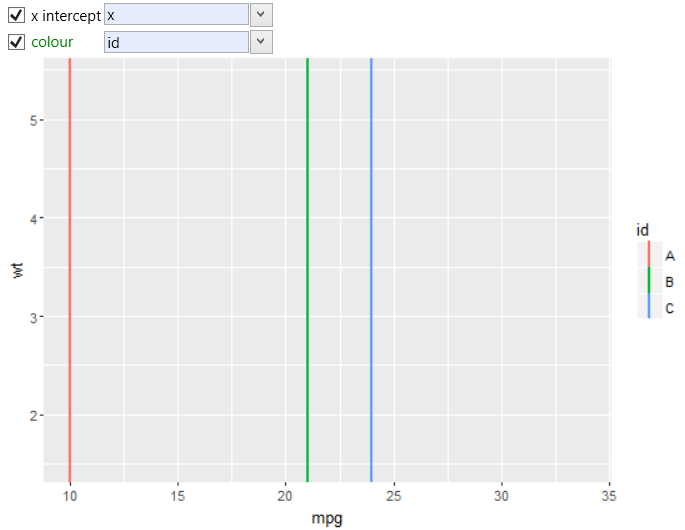
If we associate geometry with this dataset, we can map individual
variables to the properties of the geom_vline object. In the
following example, we mapped the position property x intercept
to the x variable and the line color we mapped to the id variable.
The result of such mapping is shown in the following figure.
Similarly, geom_hline geometry layer is defined.