In the following article series I want to show you how you can use Stagraph in conjunction with Microsoft Power BI Desktop. With Stagraph you can greatly expand your options in Power BI without programming. In the first article I describe how you can link Power BI Desktop with Stagraph. In the second article, will be presented practical application.
What is Power BI Desktop?
Power BI Desktop is a desktop based business analytics tool provided by Microsoft. Power BI provides interactive visualizations with self-service business intelligence capabilities, where end user can create reports and dashboards.
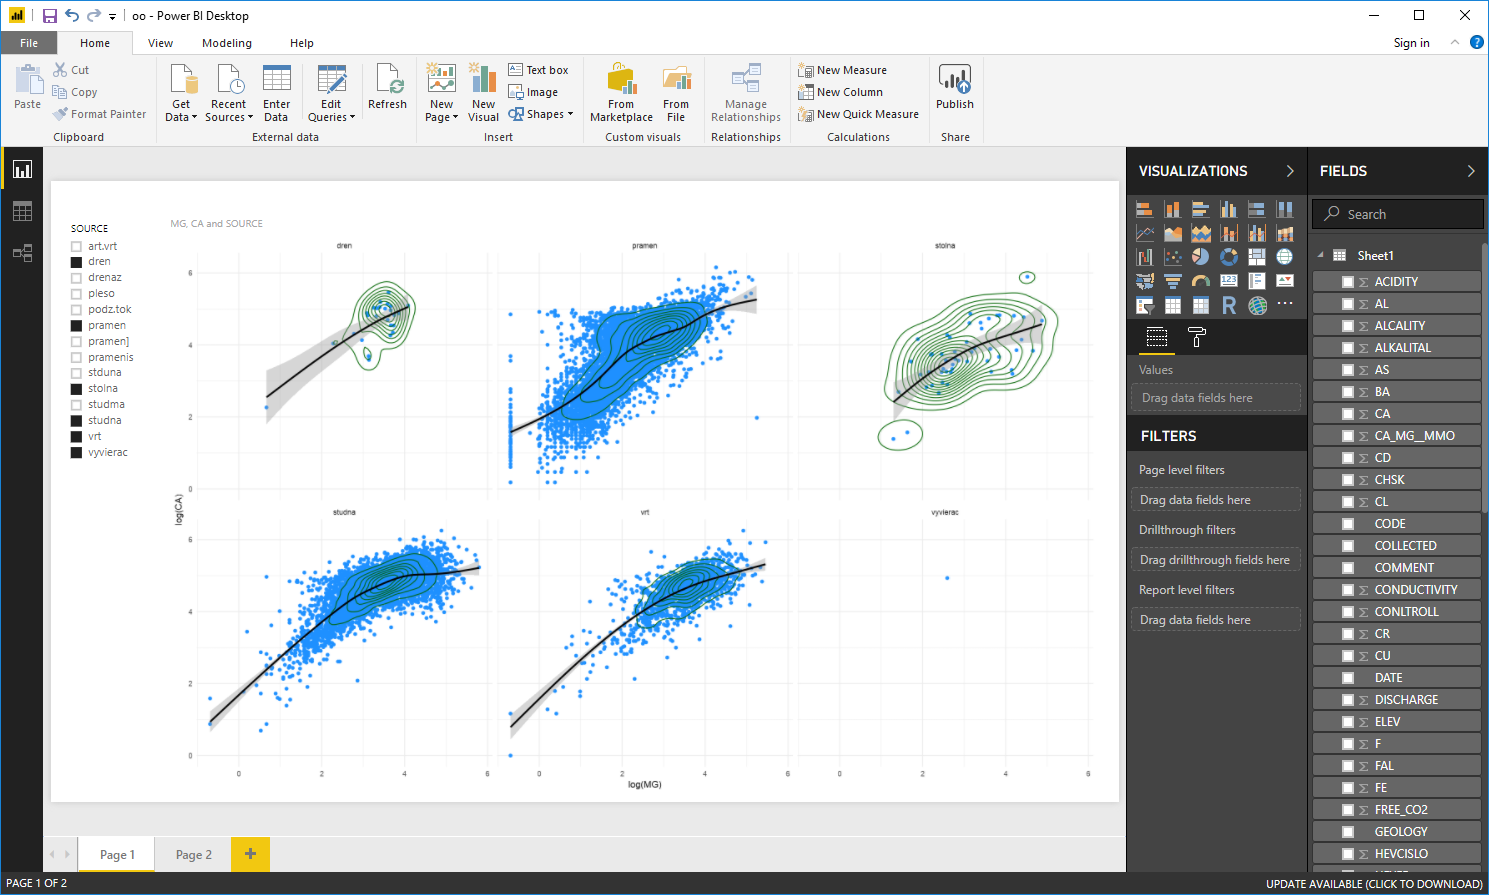
Overall, Power BI is a tool that is easy to use and you can use it to create interactive visualizations. For this purpose, the visuals are found in the Visualizations Panel. In addition to built-in visuals, can also be imported custom visuals. Third option is to insert statistical graphics that were created by R language. Power BI Desktop supports the use of R language.
Power BI & R Language?
If you want to insert a graph to your dashboard that is created through the R script, click (in the Visualizations Panel) on the R Script Visual button.
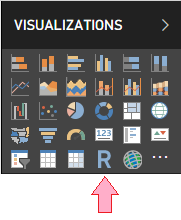
An empty object is inserted into your dashboard and R script editor appears in the bottom part of the window. In this editor, you define the R script that creates the desired graph.
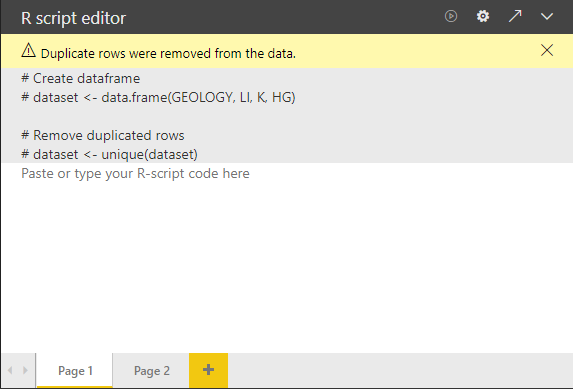
The disadvantage (and also advantage :-) ) of this approach is that you must be able to program in R language. Power BI allows you to edit and debug this script in an external R code editor, such as R Studio. In addition to the default R Studio, you can also use other editors such as Stagraph.
Power BI with Stagraph?
The advantage of Stagraph is that all your steps in the visual interface are automatically converted to R scripts. Thanks to this feature you can use your work outside the Stagraph - for example, in the Power BI Desktop.
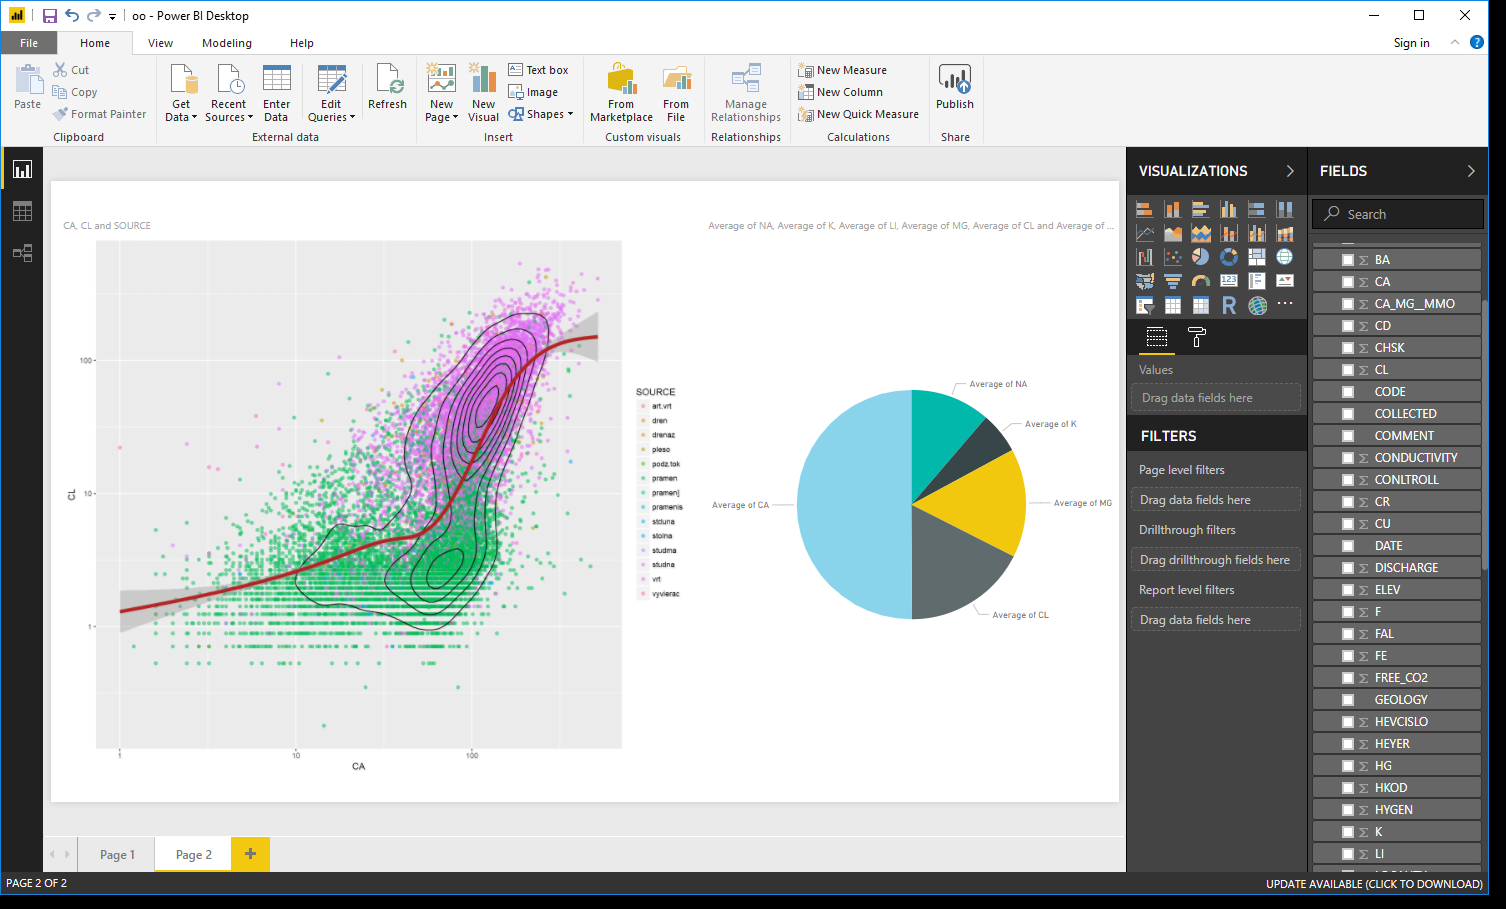
As an example, the following figure can be mentioned. We have imported into the Stagraph selected dataset variables from the Power BI project. On this data, we have created a statistical graph which shows the relationship between the concentration of calcium and chlorides in the groundwater of the Slovak Republic ( > 16,000 chemical analyzes).
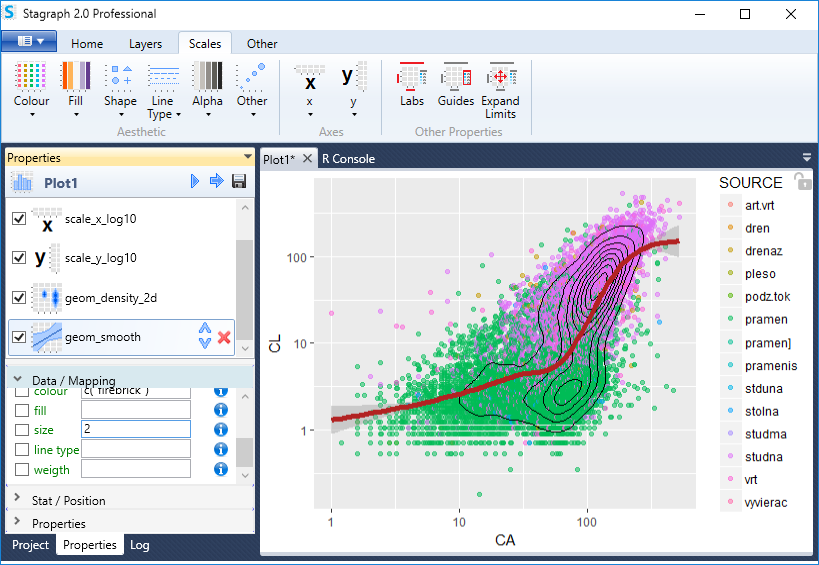
Created plot can be exported as an R script from Stagraph and inserted into the Power BI dashboard.
Stagraph allows you to export R scripts only in the Professional Edition. In the Free version, you can create selected chart types, but you can’t export them.
An example of the R plot, imported back to Power BI, is shown in the following figure. After import, you can use these plots along with other Power BI features such as selection, grouping or filtering.
In the Stagraph you can create simply and quick very impressive and complex types of statistical visualizations and then use them outside of the program, such as in the Power BI Desktop projects. But before that, it is required to install Stagraph and link it to Power BI. This connection is very simple.
How to connect Stagraph with Power BI?
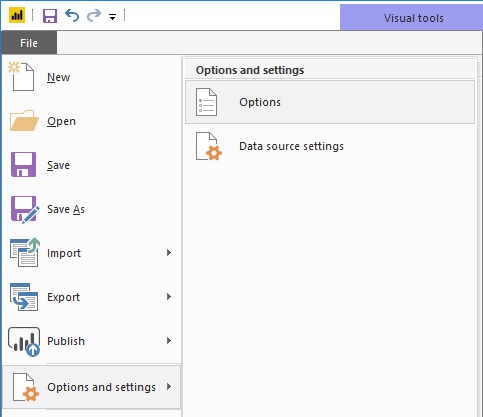
For Stagraph and Power BI Desktop connection, two parameters must be set in Power BI. After start, click on the button File - Options and settings - Options.
In the dialog that appears, click on the R scripting item. Under this item, you can set two properties, namely the R Runtime location on the computer disk and the external R IDE that is used for scripts editing and debugging.
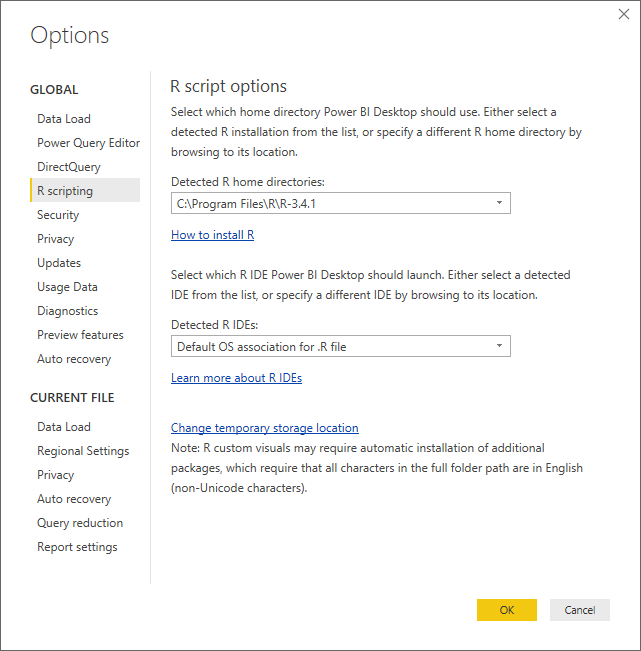
First, we need to set the parameter Detected R home directories - the placement of R Runtime on your computer’s disk. If you have R installed in your computer, the program automatically detects it. For Stagraph - Power BI connection is required to have both applications connected to the same R instance. Stagraph by default uses the R4Stagraph distribution.
If you want the applications to be fully compatible, I recommend you setup the R4Stagraph in Power BI. You can download it here. After installation, you can find it in the Program Files directory:
C:\Program Files\R4Stagraph
Set the first combo-box to Other and the second redefine using the Browse button to mentioned value (C:\Program Files\R4Stagraph). Now both applications will use the same instance of R (with all required R packages).
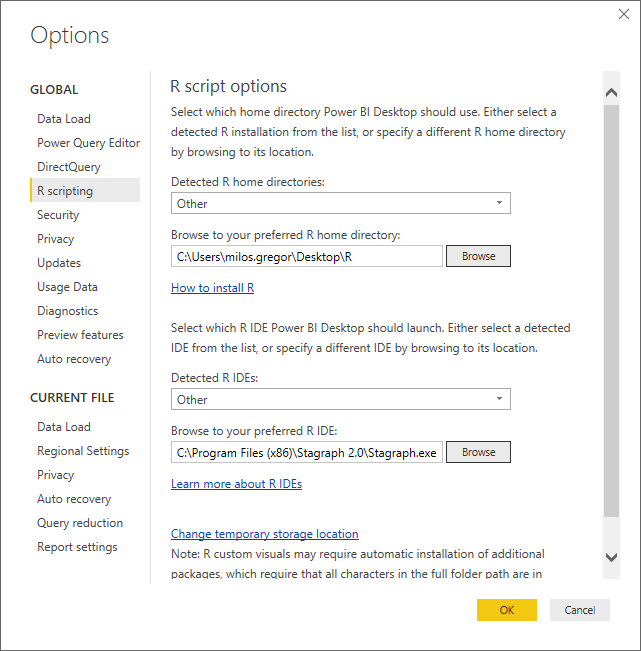
Finally, set the Detected R IDEs combo-box to Other. Using the Browse button find the Stagraph application on the computer disk. After installation, you can find it at:
C:\Program Files\Stagraph 2.1\Stagraph.exe.
After pressing the OK button, Power BI - Stagraph connection is defined. Then you can use the Stagraph functionality described in the following procedure:
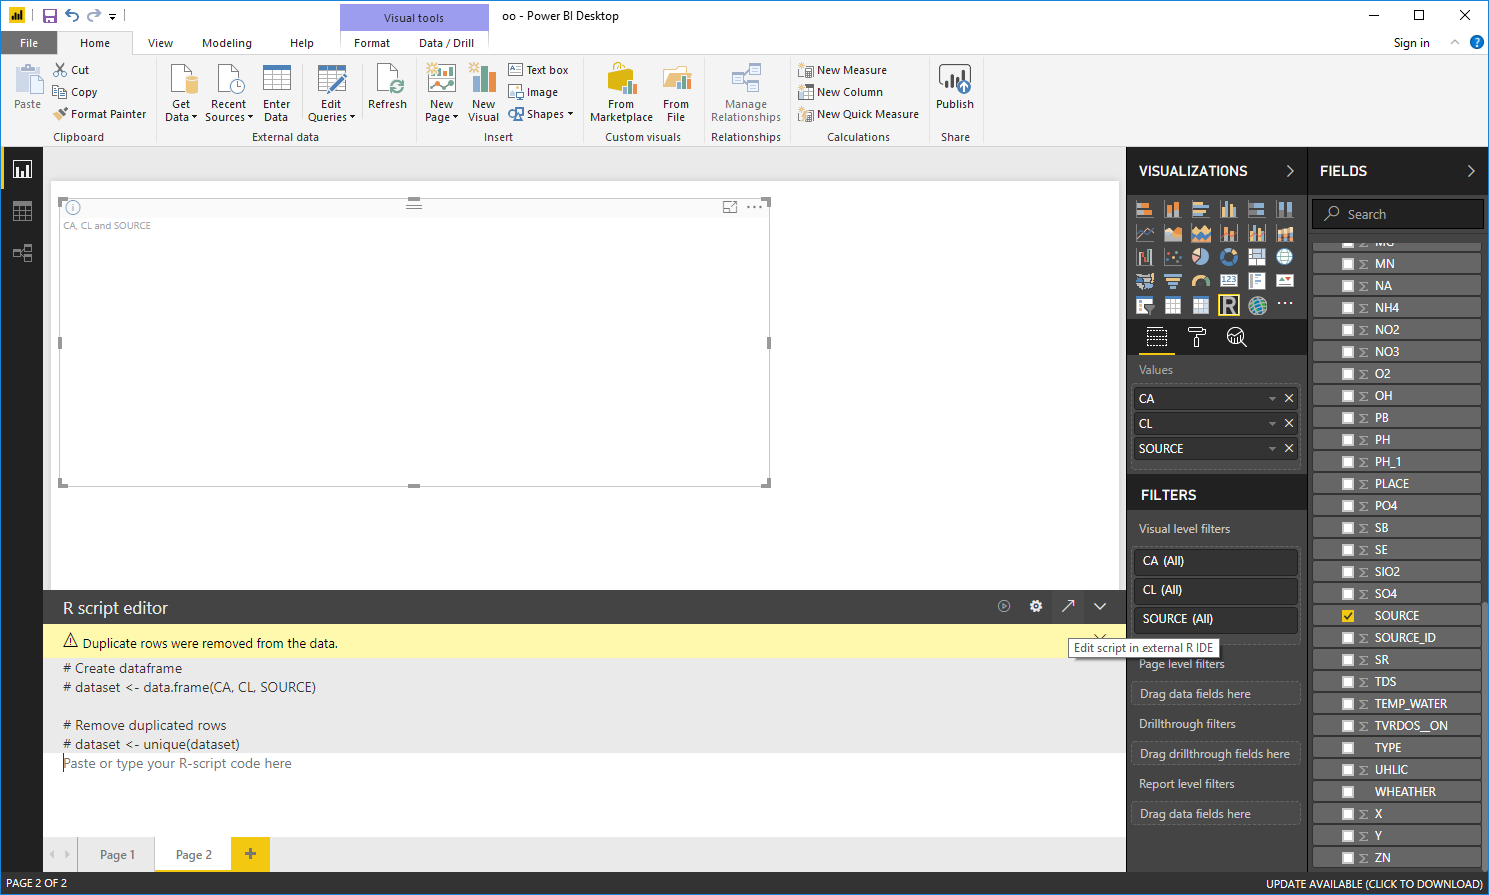
- Insert the R Script Visual into the dashboard.
- In the Fields panel, select the variables you want to work with. After their selection R script is automatically created in the R script editor. This script will create the dataset in R Runtime.
- Selected dataset variables you can send to Stagraph and create custom data visualization. Click on the third button in the R script editor header - Edit script in external R IDE.
- Power BI creates R script that allows you to load selected data in Stagraph.
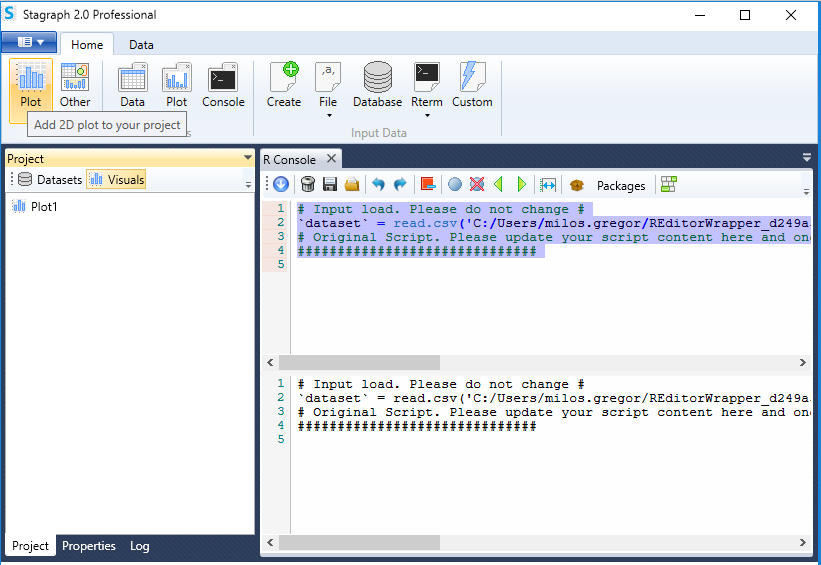
Subsequently, you execute the dataset in Stagraph and create data visualization according to your needs. In the next article, we’ll show you how to create custom data visualization and how to import it back to Power BI.
By combining these programs, you have in your hands very powerful tools for visual data exploration and statistical graphics without the need of programming. Stagraph will do it for you automatically. Using the Stagraph functions and features, you can make very impressive data visualizations quickly, simply and efficiently.
See also Stagraph & Power BI Desktop [Part 2]
�