Data Import
Basic introduction of data import features is displayed in the following video-tutorial.
This tutorial shows the data import workflow in Stagraph. Imported data can be used
immediately in your data
visualizations or you can edit
(preprocess) them.
Data Import Functions
Data import is obviously the most important feature of every program that is
focused on work with data. Stagraph is a visual interface that is built on the
top of the R Runtime. This means
that if you can import your data to R Runtime, you can also work with them in the
Stagraph. Overall, there are only two limitations.
First is the dataset size limit and the second limit is the data structure. You can
work with datasets that can be loaded into your computer’s memory. In real practice
(if you don’t work with
Big Data), for 90 % of cases you will not reach the maximum dataset size
limit. This limit can be solved in several ways (e.g. larger RAM, 64-bit R Runtime,
in-database preprocessing, sampling, partial import, ...).
In the term of data structure, you can load input data to R Runtime in various forms.
Stagraph (in 2.0 version) allows you to work with data that has the character of
tables (rows and columns). Your data is automatically stored in the
data.frame object. data.frame objects Stagraph
recognizes and allows you to use them in a visual interface.
As mentioned, your data can be imported from practically any source, such as
files, databases or web services. In the Stagraph, you can import your data
using a built-in visual interface
or through custom R scripts. Individual data import functions are described in
individual subchapters.
Create Dataset
For the data import are used functions in the ribbon toolbar tab Home
(Input Data group). Overall, there are 5 buttons prepared for the
data import. Each of them can be used in a different case (data source type).
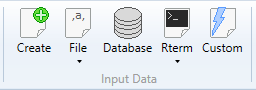
Using the Create
function, you can prepare your dataset directly inside the program in built-in
spreadsheet. Under the File button, you find options for importing data
from three file types - Excel files, CSV files and DBF files. With the
Database
button, you can import data from various databases via an
ODBC driver.
Under the Rterm button, you find functions for importing data from the
background-running R Terminal. You can load a
sample dataset or
maps
(spatial data from maps
package). Finally, using the Custom
button, you can import any type of data (that are not directly supported by the
visual interface) through the custom R scripts - e.g. JSON files, XML files,
or data from external web services. You can find a number of examples on the
Internet.
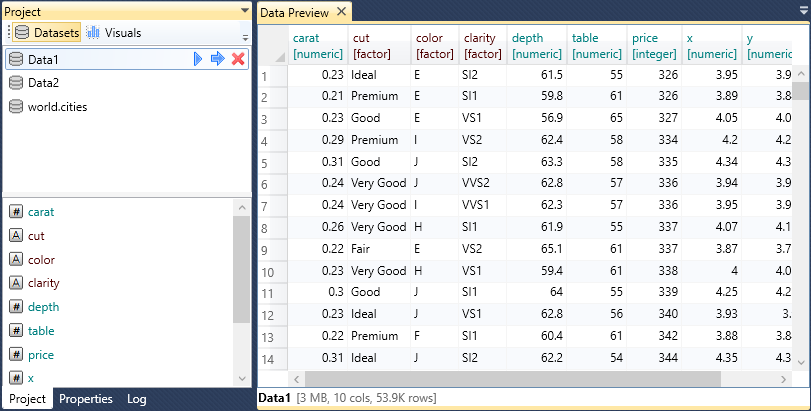
List of imported dataset you can see in the Project Panel. If you click on
the selected dataset, a list of dataset variables (columns) is displayed in at the
bottom panel part. In addition, in the document area you can display the
Data Preview Document.
In this window, you can display datasets preview. This window displays maximally
the first 200 records (rows).
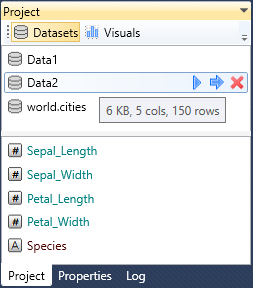
Datasets In Project Panel
As described above, imported datasets are listed in the Project Panel. If you click
on the selected one, a list of variables is displayed at the bottom panel part. This
list using the icon and font color to indicate the variable data type. Additional help
information is displayed in tooltips if you focus your mouse cursor on the selected
dataset or variable. For a dataset, the tooltip displays the amount of memory it uses,
the number of variables (cols) and records (rows). In the case of the variables the
tooltip displays the variable data type.
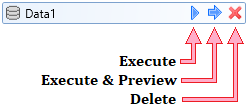
If you click on the selected dataset, three icons appears at the end of the line. Using
the first one, you can execute the dataset in the background-running R Terminal. With
the second icon you can do the same process, but the result will be displayed in the
Data Preview Document. Finally, using the last icon, you can remove the dataset from
the project (and also from the R runtime).
Additionally, if you click by right mouse button on the dataset, a contextual menu
is displayed in which you find other useful functions.
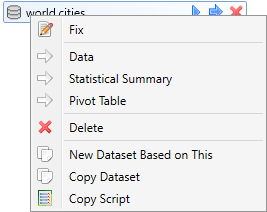
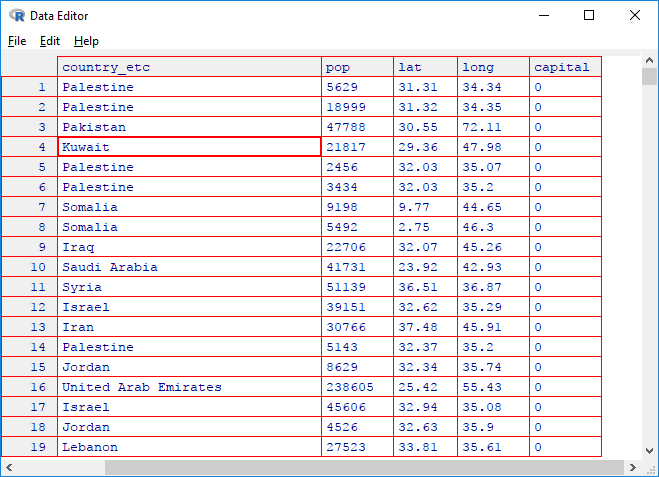
Using the Fix function, you can edit selected dataset directly (manually) in
the Data Editor. However, these edits are not saved within the project, so if
you open the current project from the disk again, all your edits will not be retained.
This editor serves only for temporary, instant and minor data edits.
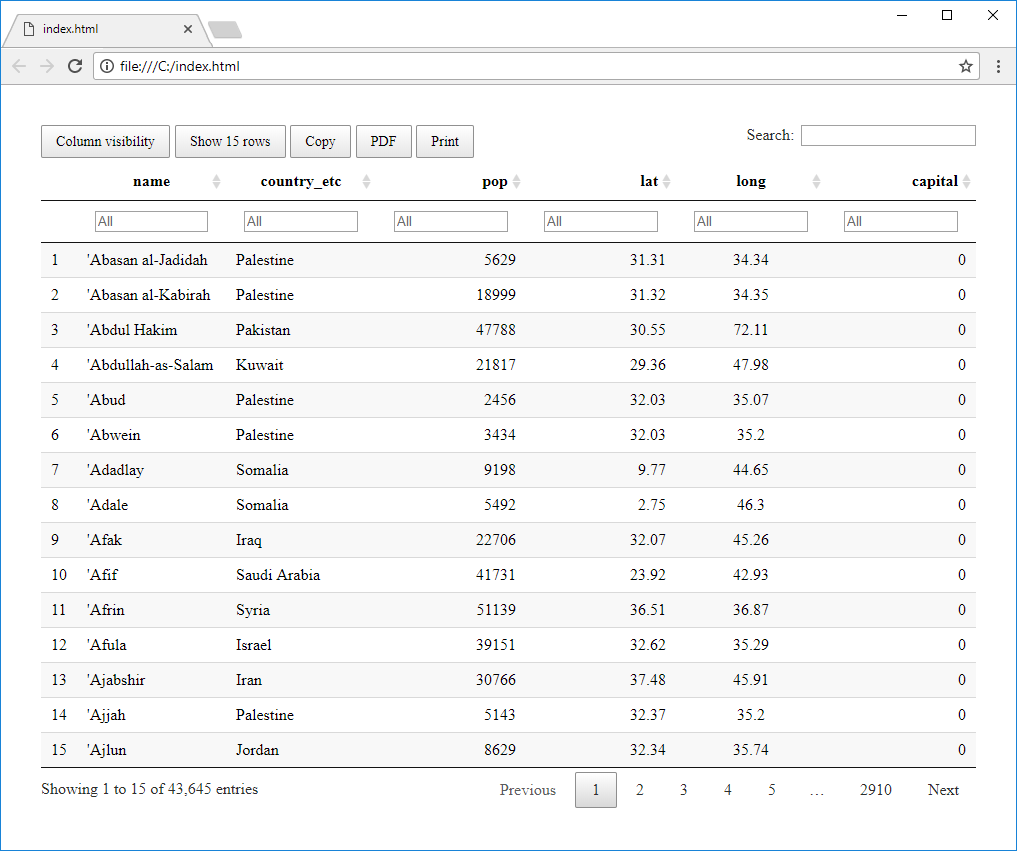
If you click on the second context menu function - Data, an interactive table with
your data will be displayed. This table is rendered in the browser. Its use is appropriate
if you are working with smaller dataset (up to 1,000 rows). With larger dataset, its
generating and interactive features will be slow.
This table contains several features, such as showing / hiding columns, adjusting the number
of visible rows, table printing or data filtering / sorting by selected columns. Created
table you can save and use in an online environment (copy / paste its source code).
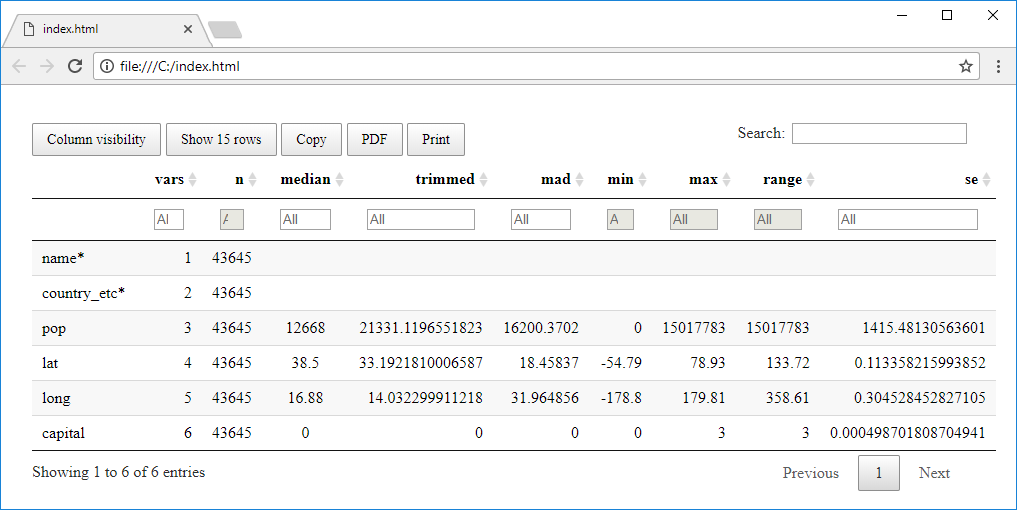
If you want to explore larger dataset, use the third context menu function - Statistical
Summary. This function also creates an interactive table. The difference is that the
table does not contains primary data, but its statistical summation. Your variables are
displayed in rows and their statistical values in columns, such as the number of records,
median, mad, min, max values, range and others.
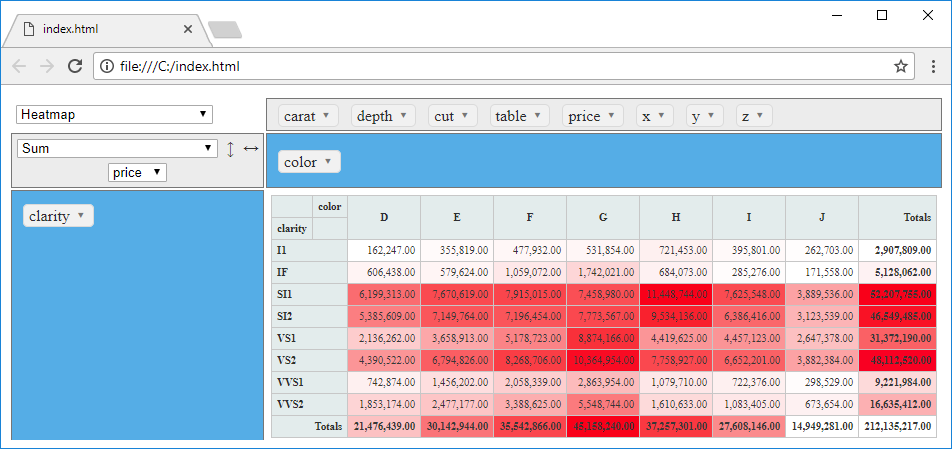
The third interactive data browsing feature is represented with an interactive
Pivot Table.
In displayed environment you can create different kinds of interactive tables, heatmaps
and graphs. Its options are much clearer from the previous video-tutorial.
Using the following Delete menu item, you can remove selected dataset from your
project. The deleted dataset is also removed from the background-running R Runtime.
The last three functions in the contextual menu serves to copy the dataset in various
forms.
With the Copy Dataset function you can create an identical copy of your dataset.
This feature is useful if you have created a dataset that loads data from a file on disk.
Imagine the following situation. You have loaded data from CSV file. On this dataset are applied
data wrangling functions. In the next step of your work you want to create the same dataset
(identical data structure and the same edits), but with the second CSV file. In this case,
it is faster and more efficient to create a copy of current dataset and only change the file
name in the Properties Panel. All functions that you apply on the first dataset will be also
used for the new one.
The function New Dataset Based on This serves for a different purpose. Imagine the import
of very large dataset from database or web service. After the import you apply several data
wrangling functions. Each time you click on the Execute button, all the data import and
processing functions are executed. This can significantly slow down your work. For this reason,
you can divide the data import and data processing into two dataset objects. In the first dataset,
you define only the data import from a source (database or web service). Then you click on the
New Dataset Based on This item in the contextual menu. A new dataset will be created as
simple link to the first dataset. Following data wrangling functions you will apply to the second
dataset. If you divide your project in this way, your work will be faster and more efficient -
the raw data and processed data will be loaded in computer memory simultaneously.
The last function - Copy Script is used to generate a script in the R language that
defines your dataset. This script includes the data import and all subsequent processing
steps. Created scripts you can use outside the Stagraph in an environments that allows you
to execute R scripts (such as R Console, R Studio, Visual Studio and many other applications
that have R integration). Described function is available only in the Professional Edition
of the program.
Finally, the last two functions you can find in the list of dataset variables. These functions
(hidden in the contextual menu) are here from the “historical” reasons and in the following
versions will be redesigned and better integrated with the Stagraph interface.
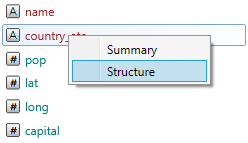
If you right-click by mouse on the selected variable, you will see a context menu containing
two functions - Summary and Structure. With these features you can display
summary information about variable and information about its structure. These informations
are displayed in the output-textbox of the built-in R Console.
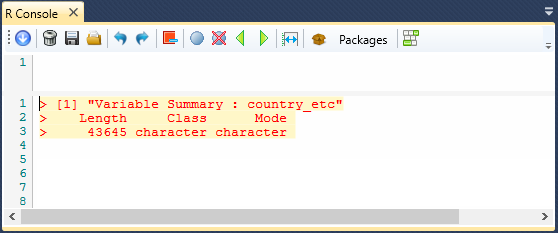
The first example shows the output of the Summary
function applied on the "country_etc" variable.
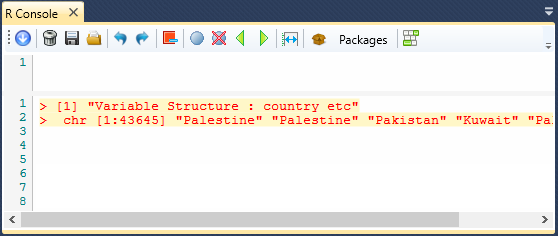
The second example shows the output from the Structure
function for the "country_etc" variable.
We described practically all the features of Project Panel (for the list of datasets).
Additional functionality for working with datasets can be found in the Properties Panel.
If you double-click on the selected dataset in Project Panel, its definition will appear in
the Properties Panel, where you can continue to work.
Datasets In Properties Panel
In addition to Project Panel, you can continue to work with datasets in the
Properties Panel. If you double-click on selected dataset in the Project
Panel, its details will be displayed in the Properties Panel. This panel is divided
into three sections. At the top is the Header containing the dataset name along
with the three buttons. Below the header is a List of Functions that are applied
to the dataset. The first item in list is always a data import function.
Subsequently, this list can contain functions for data cleaning and data wrangling.
If you select function from the list, its options (arguments) are displayed.
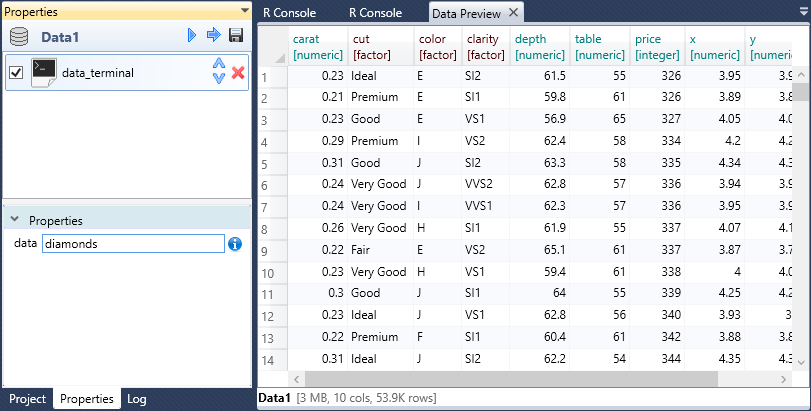
The following figure shows an example of a dataset that was created by a reference
(data_attach)
to a sample dataset (diamonds)
in the R Terminal. Finally, a preview of the created dataset is displayed in
the Data Preview Document.
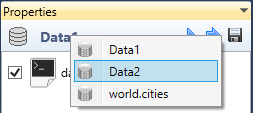
If you want to see other dataset (or an object from the Visuals group) in the
Properties Panel, right-click on the dataset icon in the Panel Header. From
displayed contextual menu you can choose the object that you want to display
(and edit).
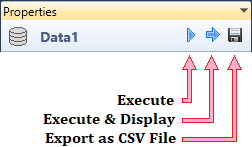
In addition to this functionality, you find three buttons in the Panel Header.
Using the first one, you can execute the dataset in the background-running R
Runtime. Using the second button, you can do the same process but the result
will be displayed in the Data Preview Document.
Finally, using the last button - Save, you can export the created and
pre-processed dataset locally to a disk in the form of CSV File (tab-separated
CSV file). This feature is useful if you are using the Stagraph for data import,
data cleaning and statistical processing.
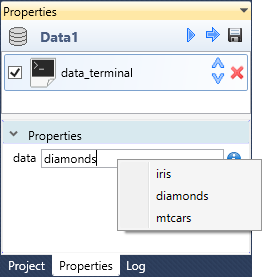
As has been said, in the bottom part of the Properties Panel is possible to
modify the individual functions parameters. In the following example, we
can replace the sample dataset. Using the data_attach
function you can attach a dataset that you created manually through the
built-in R Console, or you can refer to a sample dataset. In the function
properties, you can often use features hidden in contextual menus. In the
following illustration, the contextual menu offers a selection of three
commonly used sample datasets (iris,
diamond and
mtcars).
When you click on the context menu item, the selected dataset is attached.
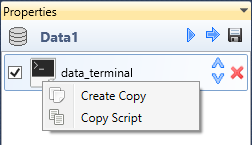
Functions that are hidden in the contextual menu you can use also in the
list of applied functions. For this list you can use two functions
Create Copy and Copy Script. Using the Create Copy
function, you can create an identical copy of selected function that
will be applied to the dataset. With the Copy Script function
you can copy the selected function in the form of R script.
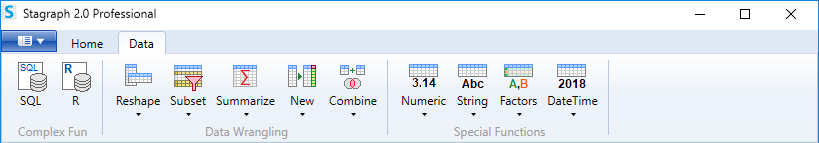
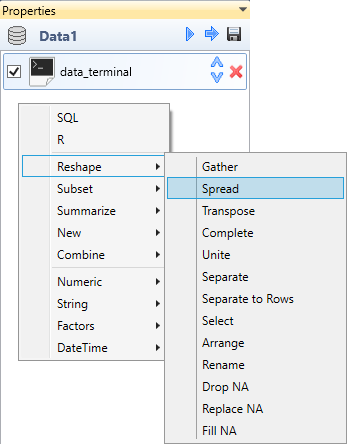
In the Properties Panel you can apply data wrangling functions to your dataset.
These functions you can add from the ribbon toolbar tab named Data. With
these functions you can clean, edit, join, filter, reshape and combine your datasets.
Data wrangling functions are also accessible directly from the Properties Panel,
if you right-click on empty space in the list of applied functions.
These functions are in detail described in the next chapter - Data Wrangling.
This chapter explains an extensive options of the data pre-processing in Stagraph.
All data import and data wrangling functions are fully functional in the Free version.
The Stagraph can be considered a full-featured free tool for data cleaning and data wrangling.
You are not limited in data sources and dataset size.