 geom_path
geom_path connects the observations points with line in the
order in which they appear in the dataset
Aesthetics
Other Properties
| lineend |
Line end style – round, butt, square |
| linejoin |
Line join style – round, mitre, bevel |
| linemitre |
Line mitre limit – number greater than 1 |
| arrow |
Arrow specification, as created by arrow |
Similar Geometries
geom_line,
geom_step
Description and Details
Using the described geometry, you can insert a geometric
object into your data visualization – a line path that
is defined by two positional aesthetic properties – x and y.
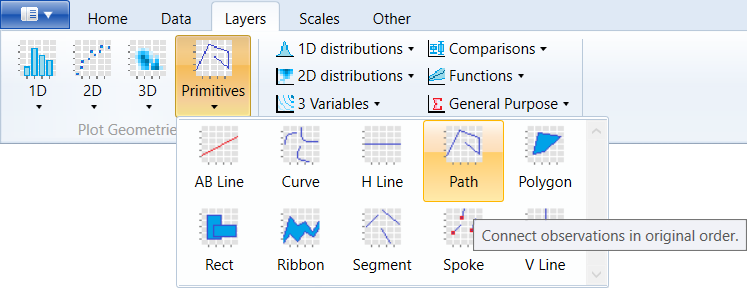
You can find this geometry in the ribbon toolbar tab
Layers, under the Primitives button.
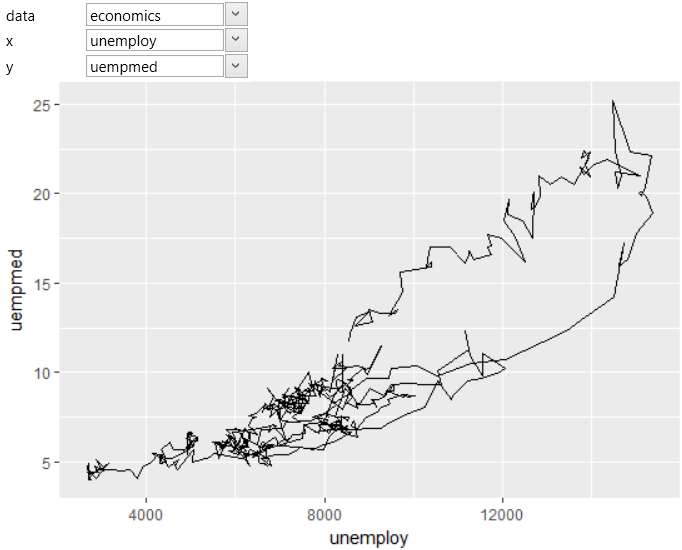
geom_path is the type of geometry, where the point coordinates
are rendered as they are stored in the dataset. This geometry
is defined by two positional aesthetic properties x and y. The
example is shown in the following figure. As the input data, we
used the built-in economics dataset and we mapped unemploy and
unemped on axis x and y. The result is a path geometry that
joins the individual coordinate points.
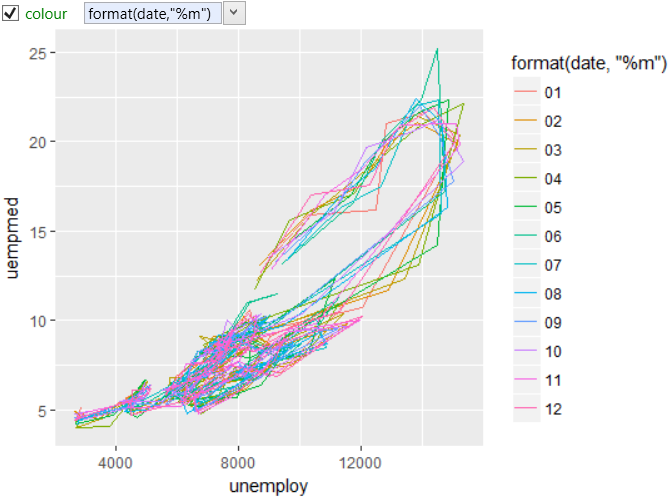
In one dataset, multiple path lines can be defined at once.
We can render them individually. However, it is necessary to
separate them by selected aesthetic property. For this, we've
used date variable in the next example. This variable has a
continuous character and therefore we have transformed it.
Using the format function was created groups that divided
dataset by months and these groups were used to create
individual line paths.
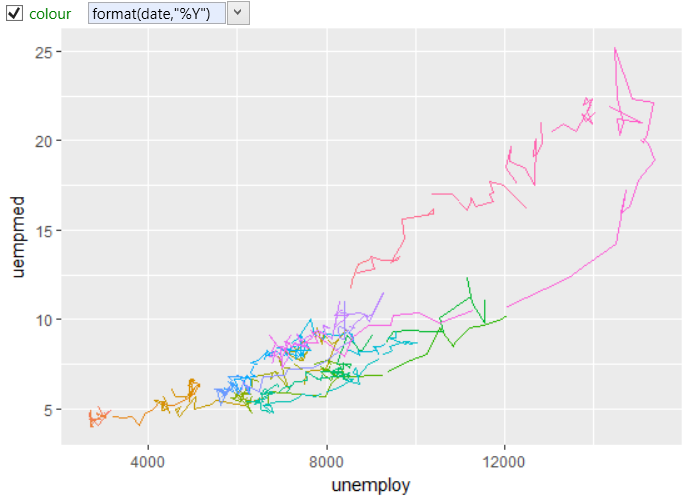
In the following example, we also divided the dataset trough
the color aesthetic parameter, but by years. The format function
returns the year value from date and divided the dataset
into groups according to this value. The resulting visualization
is shown in the following figure.
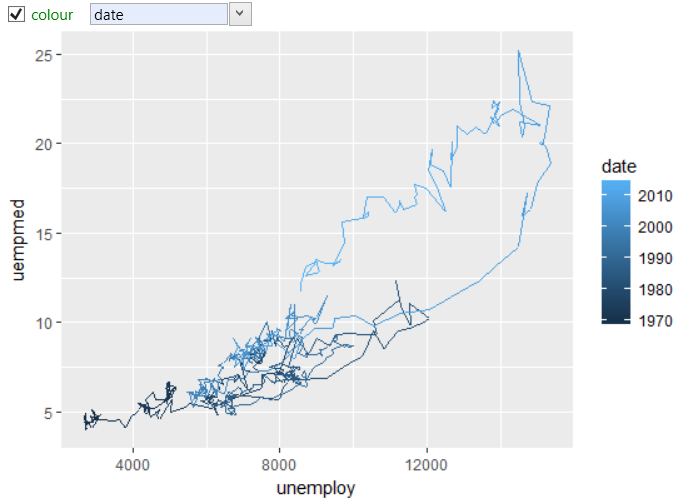
Finally, in the next example, we mapped the color property
to date, but without any transformation. Since the date is
a continuous variable, the color changes gradually.
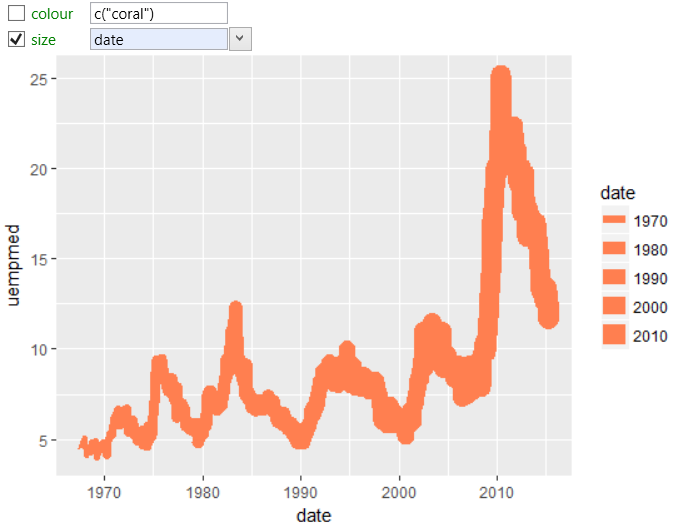
In the same way, you can work also with other aesthetic
properties, like with the line thickness, through the size
property. The example is shown in the following figure. In
the course of time, the line thickness gradually grows.
Similarly, you can define also the geom_line layer.
However, this geometry has several differences. For
example, values are before rendering ordered according
to the x-axis variable.