 geom_abline
Reference line defined by slope and intercept. Useful for annotating plots.
Aesthetics
| slope, intercept |
parameters that control the position of the line |
| alpha,
colour,
line type,
size |
classic aesthetics properties |
Other Properties
This geometry does not contain other properties.
Similar Geometries
geom_line,
geom_hline,
geom_vline,
geom_path,
geom_smooth
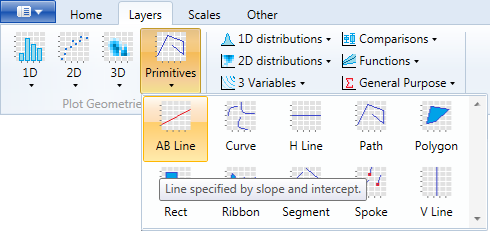
Description and Details
Using the described geometry, you can insert a simple geometric
object into your data visualization – a line defined by a position
on the Y axis and slope. You can find this geometry in the ribbon
toolbar tab Layers, under the Primitives button.
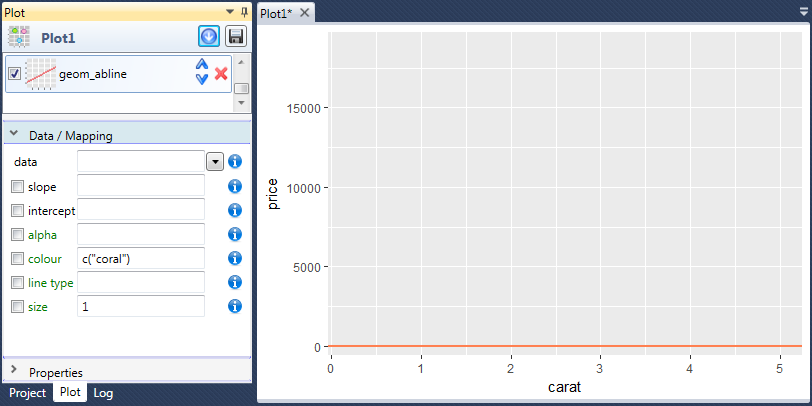
AB line geometry is defined by the slope and intercept parameter.
These values can be defined as numeric values, can be defined by
function or can be mapped from an imported dataset. After geometry
adding, the intercept and slope parameters are by default empty.
If you plot this geometry, the line will be rendered at the zero Y
coordinate and the line will be rendered horizontally (zero slope).
This line can be defined by color, transparency, line type and size.
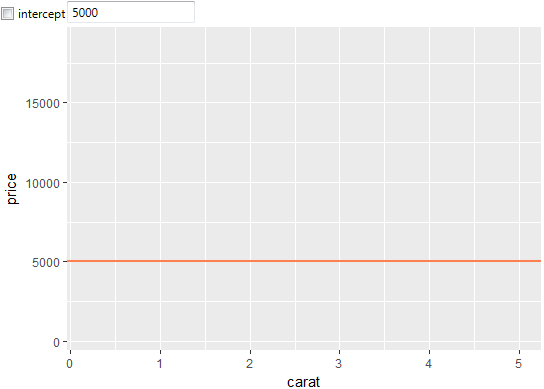
If you want to define the slope and intercept values as directly
entered numeric values, the aes check-box must be unchecked and
values entered in the text-box. In the following example, we set
the intercept value to 5 000 and the slope value we left empty.
Based on this definition, the AB line is plotted as a horizontal
line located on the Y axis at the 5 000 coordinate.
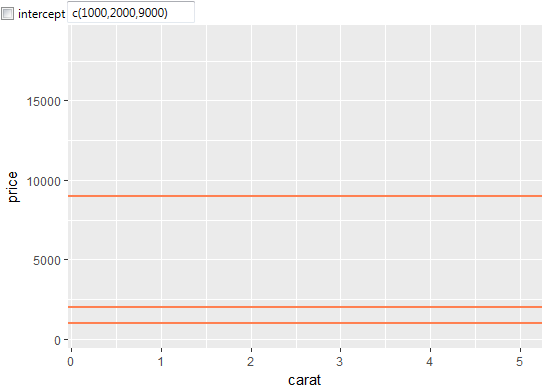
Several lines can be defined at a time. For example, if you want
to define a line at a multiple positions, you use the R function
c(),
where you put the individual values into parentheses and
separate them with commas. Subsequently, these lines will be
plotted as in the following illustration.
If you also define the slope parameter, the line is plotted below a defined slope.
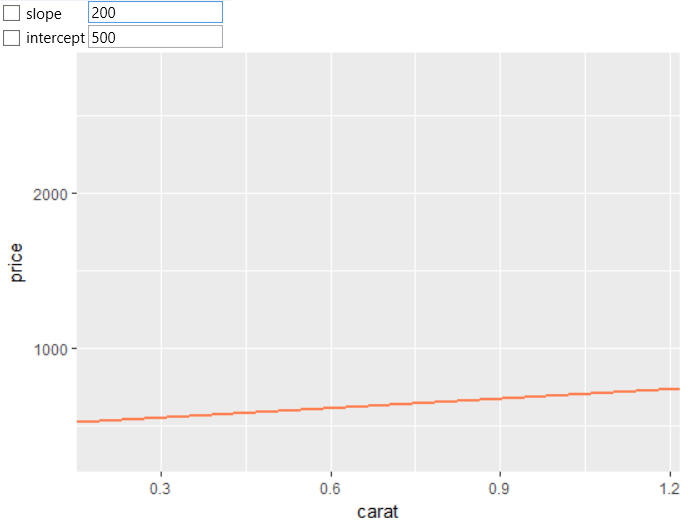
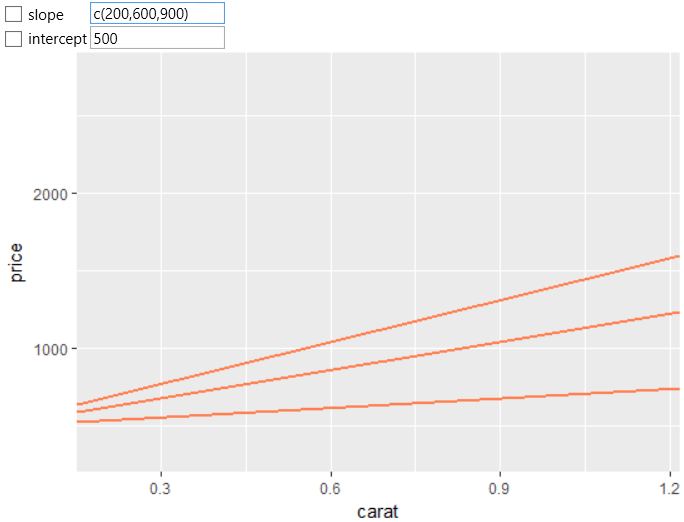
You can also define multiple lines at once using the slope parameter.
The definition of these lines must also be enclosed in parentheses
after the c function.
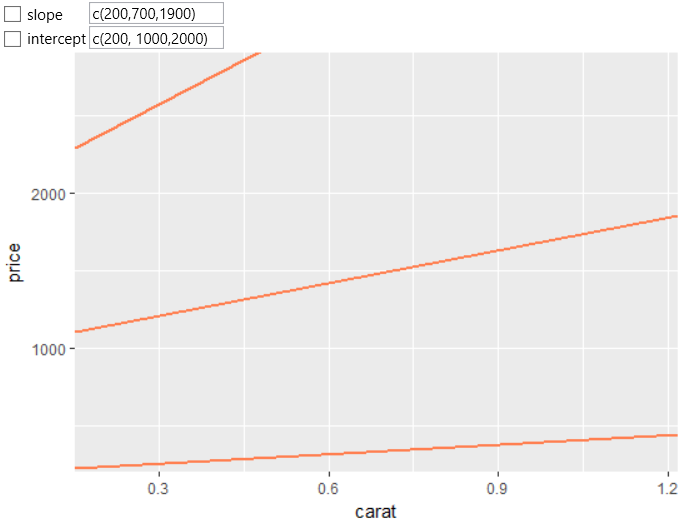
If you want to define multiple AB lines at once, with variable
values of slope and intercept, you can do it in the same way.
The condition is that the number of defined values (slope &
intercept) is the same.
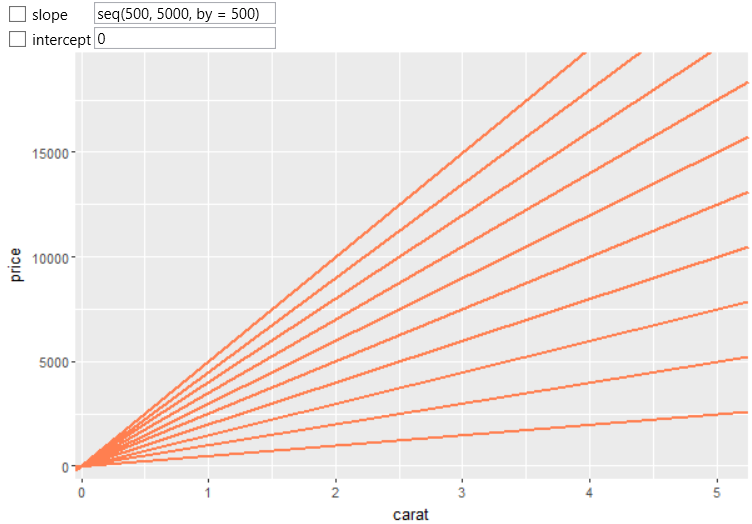
Finally, you can define the values through the selected R function.
In the following example, we define the slope values using the seq
function, which generates a sequence of values that are based on
specified function arguments. Used function in example creates
array of numeric values ranging from 500 to 5 000 in step 500.
The output is shown in the following figure.
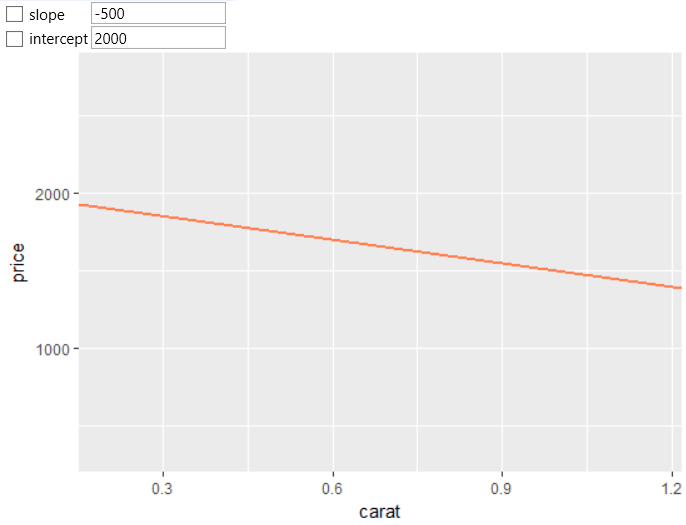
If you define the slope value as negative. The AB line will be
plotted as a descending curve. The example is in the following
figure.
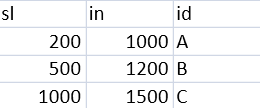
In addition to direct setting of required parameters, the slope
and intercept properties can be mapped to variables from the
imported dataset. The structure of the imported dataset is shown
in the following figure. The dataset contains three variables
(sl, in and id) with three values. We have imported this datset
in the program.
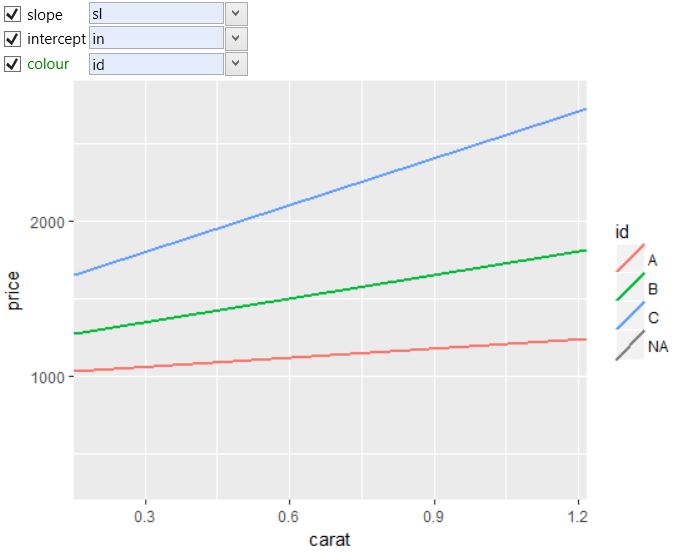
The dataset name we set in the data property and consequently,
we can map the dataset variables to other layer properties.
As an example in the following figure, we mapped the slope
parameter to variable sl, the intercept parameter was mapped
to in variable and finally the color aesthetic was mapped to
id dataset variable.
Unlike most other geoms, geom_abline do not inherit aesthetics
from the plot default, because they do not understand x and y
aesthetics, which are commonly set in the plot. They also do
not affect the x and y scales. Similarly, geom_hline and
geom_vline are also defined. The geom_smooth geometry can be
visually similar, but its definition is fundamentally different.