 geom_dotplot
In a dot plot, the width of a dot corresponds to the bin width
(of maximum width, depending on the binning algorithm), and dots
are stacked, with each dot representing one observation.
Aesthetics
Other Properties
| binwidth |
When method is "dotdensity", this specifies maximum bin width. When method is "histodot", this specifies bin width. Defaults to 1/30 of the range of the data |
| binaxis |
The axis to bin along, "x" (default) or "y" |
| method |
"dotdensity" – default for dot-density binning, or "histodot" for fixed bin widths – like stat_bin |
| binpositions |
When method is "dotdensity", "bygroup" – default determines positions of the bins for each group separately. "all" determines positions of the bins with all the data taken together; this is used for aligning dot stacks across multiple groups |
| stackdir |
which direction to stack the dots. "up" (default), "down", "center", "centerwhole" – centered, but with dots aligned |
| stackratio |
how close to stack the dots. Default is 1, where dots just touch. Use smaller values for closer, overlapping dots |
| dotsize |
The diameter of the dots relative to binwidth, default 1 |
| stackgroups |
should dots be stacked across groups? This has the effect that position = "stack" should have, but can't – because this geom has some odd properties |
| origin |
When method is "histodot", origin of first bin |
| right |
When method is "histodot", should intervals be closed on the right (a, b], or not [a, b) |
| width |
When binaxis is "y", the spacing of the dot stacks for dodging |
| drop |
If TRUE, remove all bins with zero counts |
Computed Variables
| x |
center of each bin, if binaxis is "x" |
| y |
center of each bin, if binaxis is "x" |
| binwidth |
max width of each bin if method is "dotdensity"; width of each bin if method is "histodot" |
| count |
number of points in bin |
| ncount |
count, scaled to maximum of 1 |
| density |
density of points in bin, scaled to integrate to 1, if method is "histodot" |
| ndensity |
density, scaled to maximum of 1, if method is "histodot" |
Similar Geometries
geom_density,
geom_freqpoly,
geom_histogram
Description and Details
Using the described geometry, you can create dot plot that is
defined by a position aesthetics x and y. You can find this
geometry in the ribbon toolbar tab Layers, under the 1D button.
According to the core documentation
there are two basic approaches: dot-density and histodot.
With dot-density binning, the bin positions are determined by
the data and binwidth, which is the maximum width of each bin.
See Wilkinson (1999) for details on the dot-density binning
algorithm. With histodot binning, the bins have fixed positions
and fixed widths, much like a histogram.
When binning along the x axis and stacking along the y axis, the
numbers on y axis are not meaningful, due to technical limitations
of ggplot2. You can hide the y axis, or manually scale it to match
the number of dots.
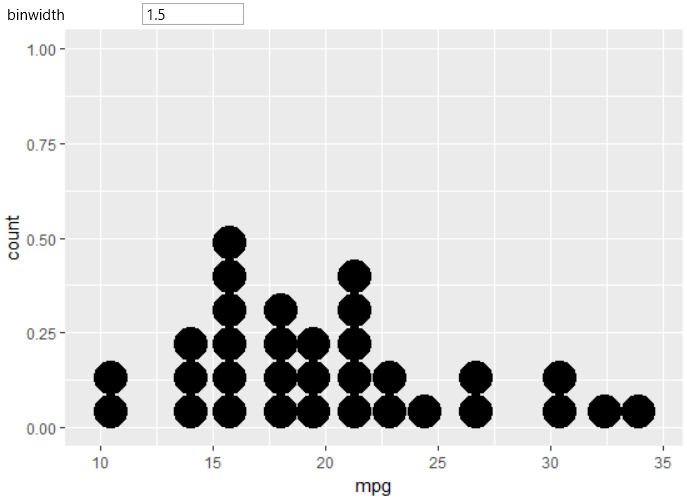
For practical examples we will use built-in dataset, named
mtcars. In the first example we create simple dot plot based
on mpg variable that is mapped on x axis. Result is shown on
the following figure.

The size of individual dots can be defined using the binwidth
utility. The result is shown in the following plot.
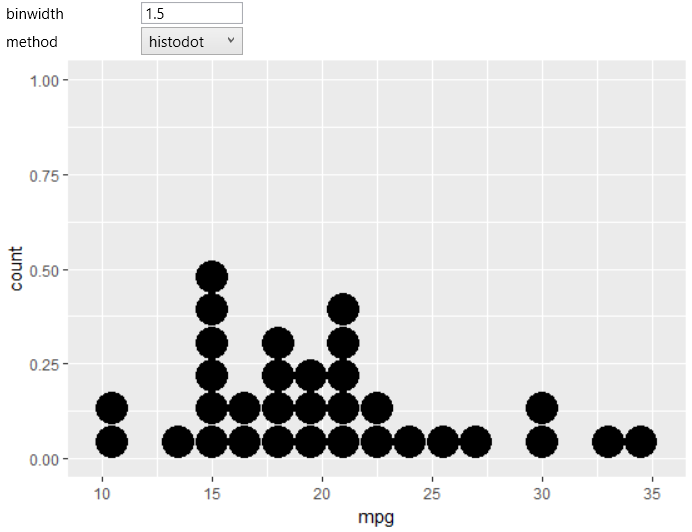
If you want to define fixed-width of bins, change the method
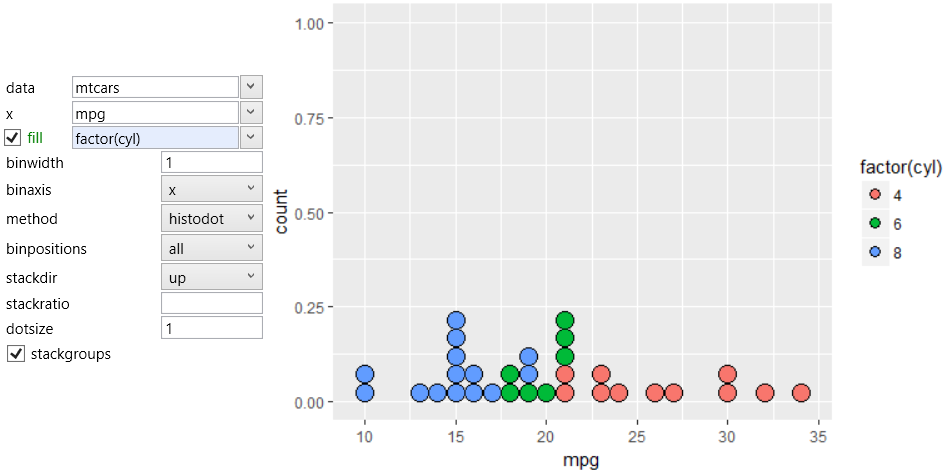
property to hisdot. The example is shown in the following plot.
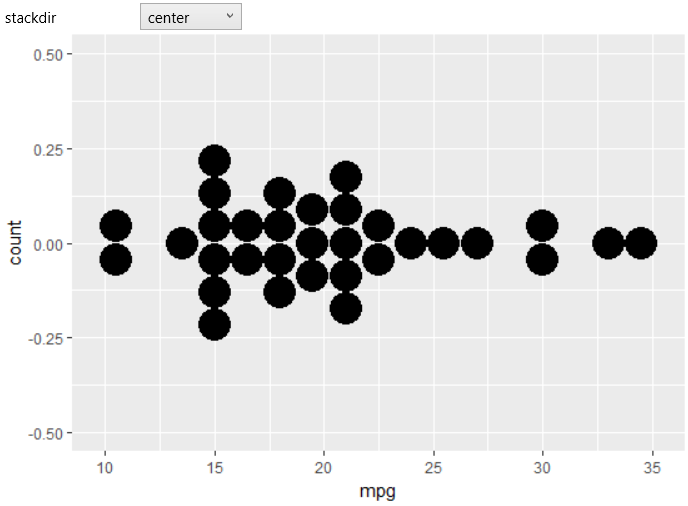
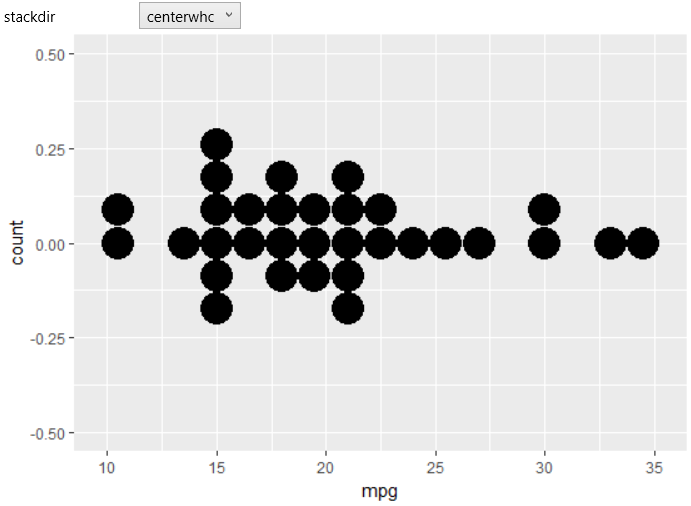
Another helpful property is stackdir. With this parameter,
you can change the stacking method for dot plot. The following
two figures show examples of stackdir property changes (to center
and centerwhole).
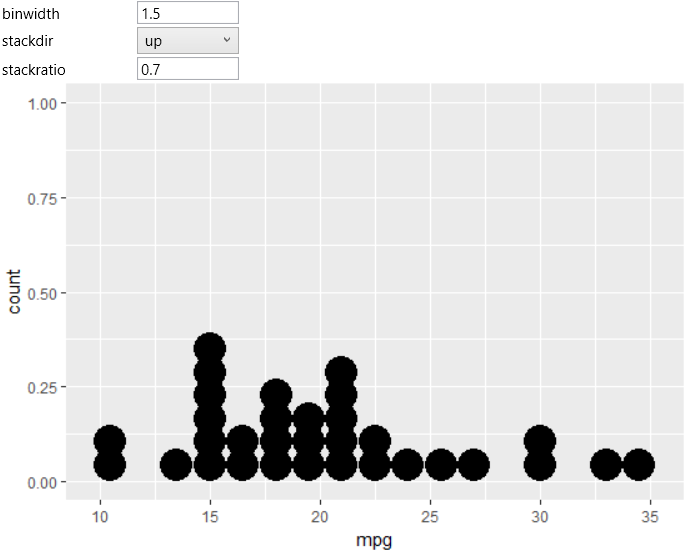
If you want to overlap dots vertically, change value in the
stackratio property. In the following plot we change this
value from 1 to 0.7.
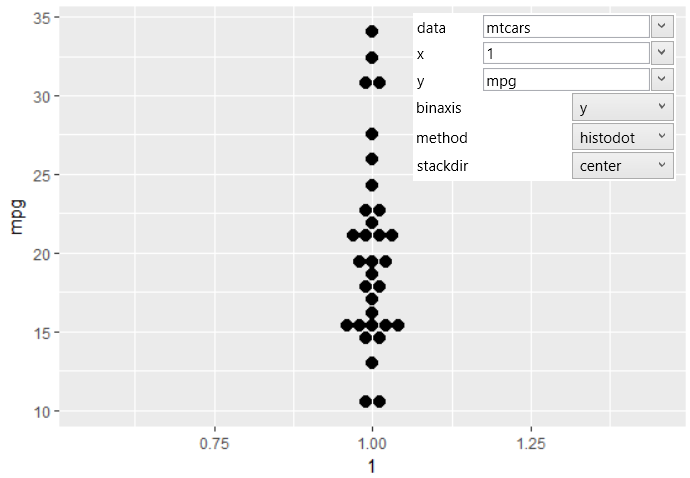
The geom_dotplot geometry can be stacked also along the y
axis instead of x. For this purpose is the binaxis property
used. If you change the stackdir parameter to the center,
values will be aligned to the center. An example is shown
in the following plot.
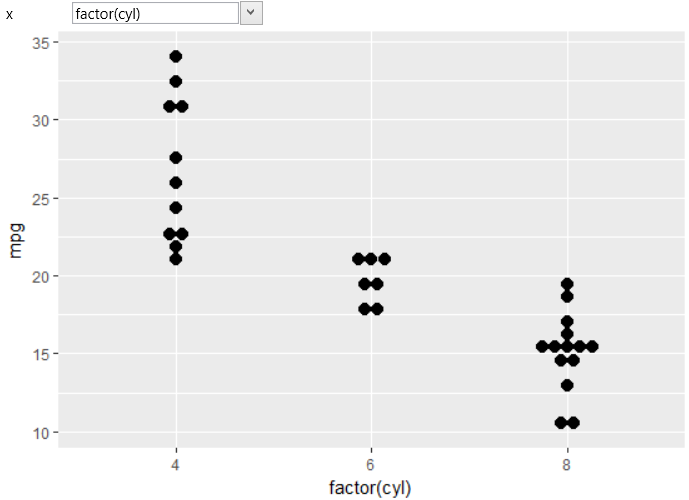
In previous examples, created dot plots were based in one dataset
variable. The following examples show the use of dot plot at two
position variables (cyl and mpg). In the following graph we
created the dot plot for the mpg variable, where values from
cyl variable are transformed to the categorical values (R function
factor) and mapped to the x-axis.
The last example illustrates the use of a categorical variable
cyl (R function factor)
to define the color of bins.
According to Wikipedia,
Dot Plot is frequently used as a representation of a distribution
consists of group of data points plotted on a simple scale. They are
useful for highlighting clusters, gaps or outliers and may be
distinguished from histograms in that dots are not spaced uniformly
along the horizontal axis.