geom_errorbar
Representing a vertical interval defined by x, ymin and ymax.
Each case draws a single graphical object.
Aesthetics
Similar Geometries
geom_crossbar,
geom_errorbarh,
geom_linerange,
geom_pointrange
Description and Details
Using the described geometry, you can insert a simple geometric
object into your data visualization – error bar interval that
is based on positional aesthetics x, ymin and ymax. You can
find this geometry in the ribbon toolbar tab Layers, under
the 2D button.
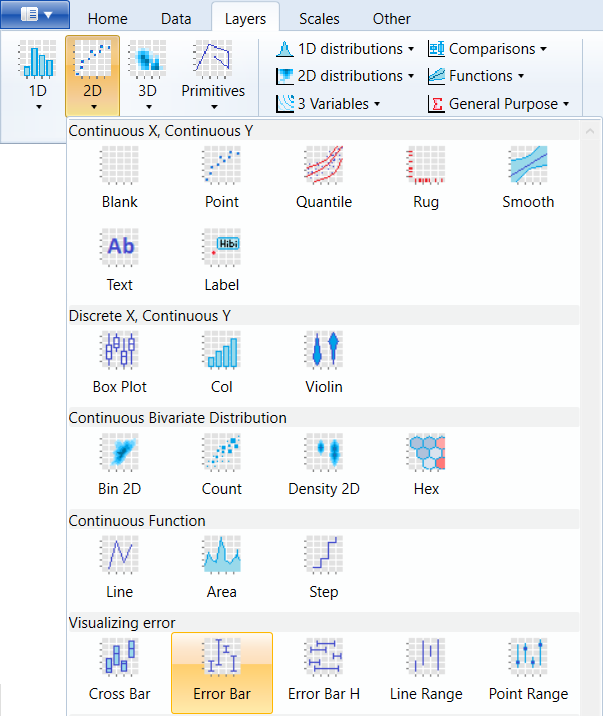
geom_errorbar belongs to a group of geometries to Plot errors.
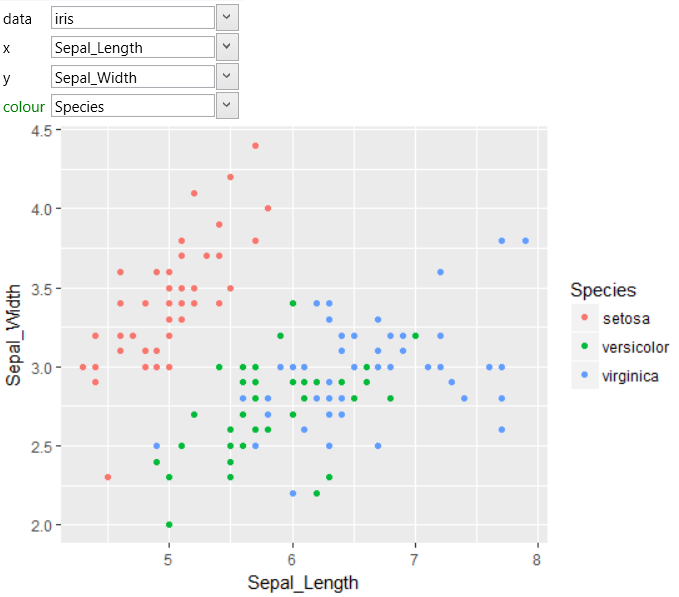
As an example, we can use built-in iris dataset. The following
visualization shows the relationship between the Sepal_Width
and Sepal_Length variables.
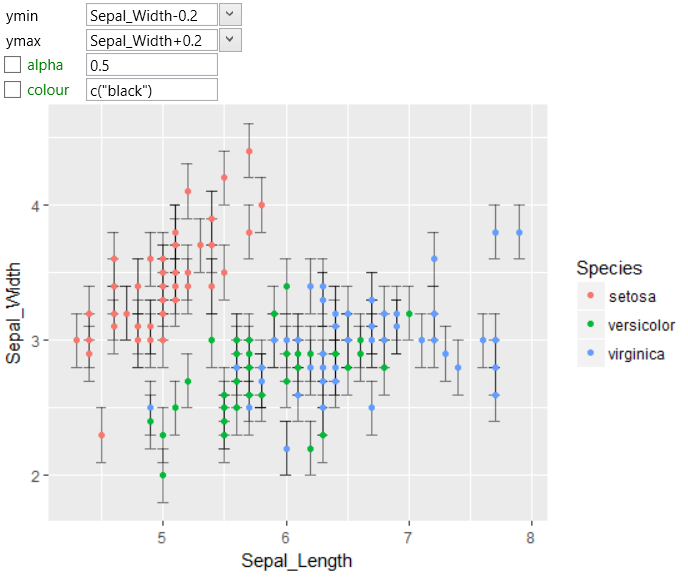
If you want to display measurement error of the Sepal_Width variable,
you can use described geometry layer. You must define the positional
aesthetic properties x, ymin and ymax. In our case, we map the x
parameter to the Sepal_Length variable. Then must be defined the
vertical interval. You can define these positions using separate
(independent) variables from the dataset or using the same
variable, adjusted by constant value or by function. For the
following example, we used the definition of vertical range by
one variable, which was modified by the same constant value (0.2).
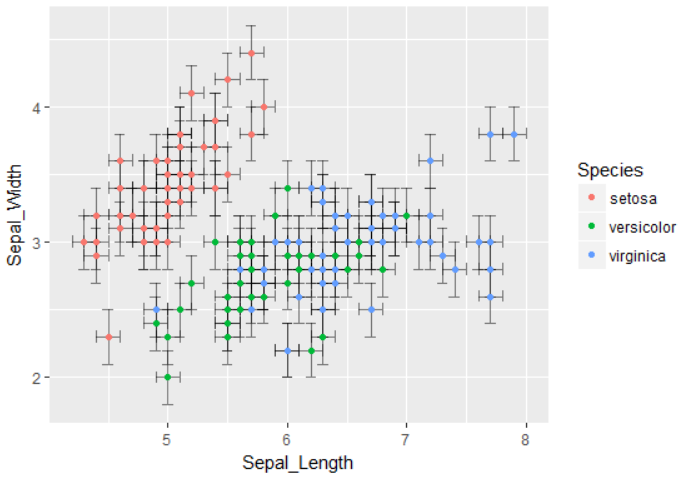
If you also want to display a measurement error in the
horizontal direction (Sepal_Length variable), add the
geom_errorbarh geometry layer into your visualization
and define it in the same way. The result may look like
in the following data visualization.