 geom_label
Adds text directly to the plot. geom_label draws a rectangle
behind the text, making it easier to read.
Aesthetics
| x, y |
required position aesthetics |
| label |
aesthetic that defines rendered text |
| alpha,
angle,
colour,
fill,
family,
font face,
group,
hjust,
vjust,
line height,
size |
classic aesthetics properties |
Other Properties
| parse |
If TRUE, the labels will be parsed into expressions and displayed as described in plotmath |
| nudge_x, nudge_y |
Horizontal and vertical adjustment to nudge labels by. Useful for offsetting text from points, particularly on discrete scales |
| label.padding |
Amount of padding around label. Defaults to 0.25 lines |
| label.r |
Radius of rounded corners. Defaults to 0.15 lines |
| label.size |
Size of label border, in mm |
Similar Geometries
geom_text
Description and Details
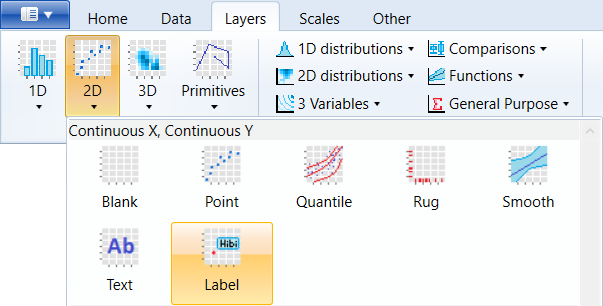
Using the described geometry, you can insert a simple object
into your data visualization – layer of text labels that are
defined by positional aesthetics x, y and label (displayed
string). You can find this geometry in the ribbon toolbar
tab Layers, under the 2D button.
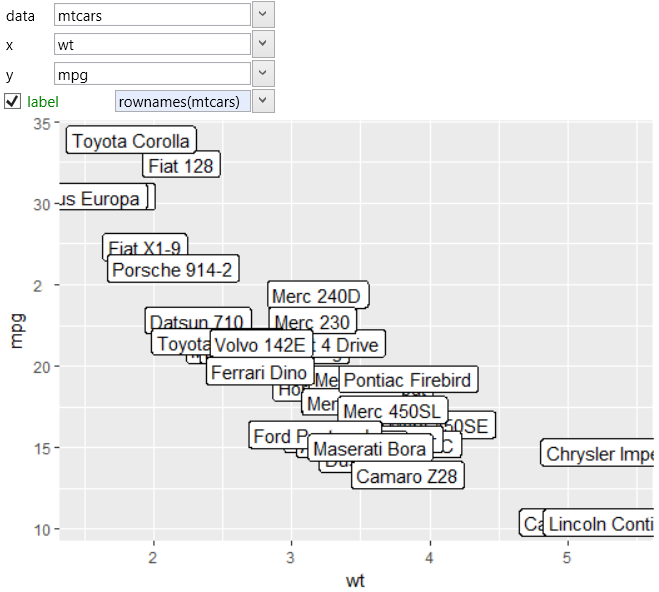
You can insert text objects into the graph using two geometries.
One is geom_text and the second geom_label. The difference between
them is that the geom_label renders strings in rectangles for
better readability. For examples, we will use the built-in mtcars
dataset. Positional aesthetic parameters are defined using the
wt and mpg variables. Finally, we need to define the variable
that contains the text that we want to display in visualization
(label aesthetic). The result is shown in the following picture.
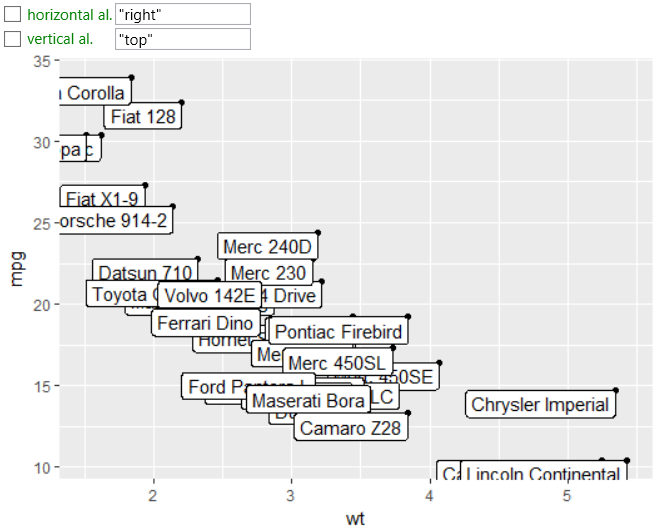
The most common auxiliary aesthetic properties that we
use (for geom_label) are properties for text alignment –
horizontal and vertical alignment. The example is shown
in the following plot. The position coordinates of labels
are marked by points. Subsequently, geom_label is aligned
to this point. Horizontal alignment is set to right and
vertical to top.
In addition, you can setup a wide range of aesthetic properties
such as color, fill or size. Other properties that are specific
for text layers are font family or font face. Their detailed
description can be found in separate chapter. An example of a
combination of their use is shown in the following graph.
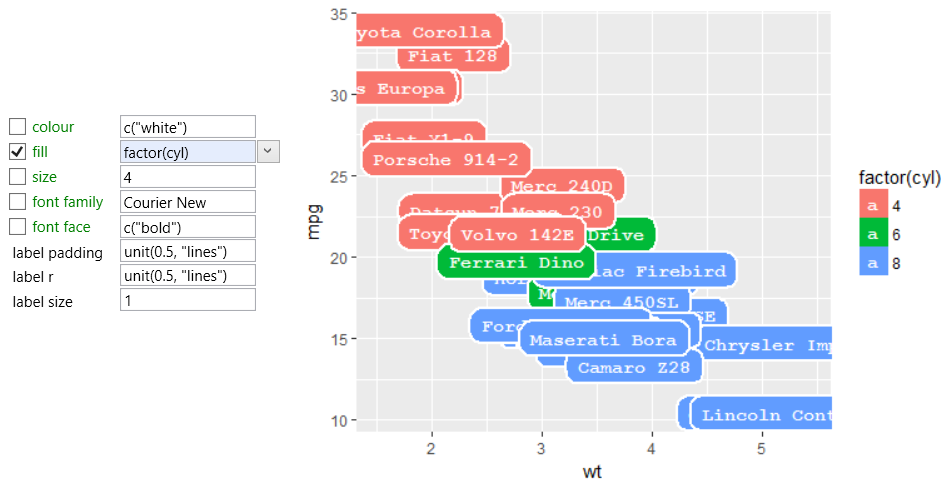
In this case, we defined the color aes as white; we mapped
the fill aes to categorical dataset variable. In addition,
we changed the font family, size and modified several visual
properties of label rectangles in that are labels displayed.
Very similarly is also defined the geom_text layer. In the
chapter about geom_text are also described other properties
and features that you can use for geom_label geometry.