geom_pointrange
Geometry representing a vertical interval defined by x, y, ymin
and ymax. Each case draws a single graphical object.
Aesthetics
Similar Geometries
geom_crossbar,
geom_linerange
Description and Details
Using the described geometry, you can insert a simple geometric
object into your data visualization – a line with point that
are defined by a position aesthetic parameters x, y, ymin
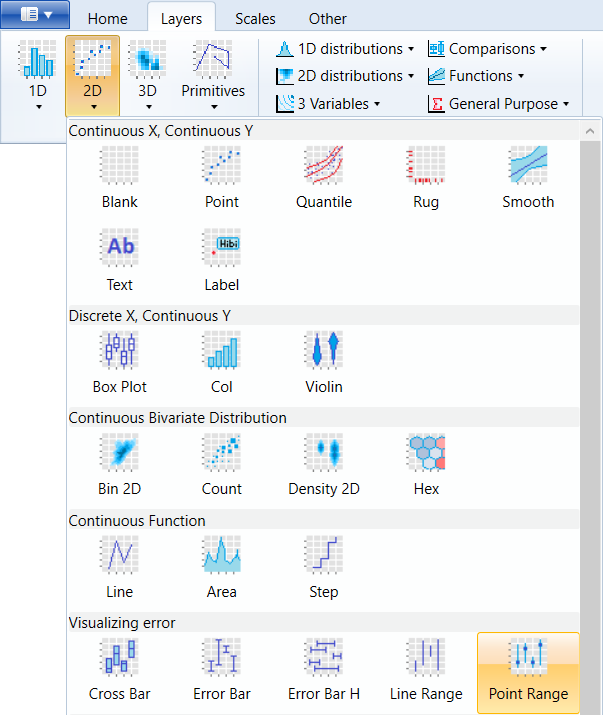
and ymax . You can find this geometry in the ribbon
toolbar tab Layers, under the 2D button.
Using this geometry, you can display a range of y values at
a defined value on the x-axis. We often use this geometry
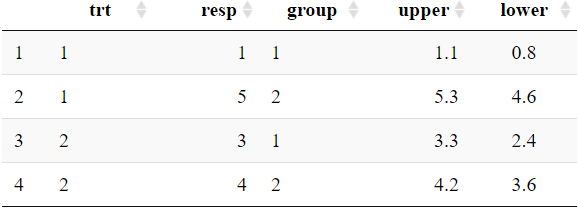
for error visualizing. For the following examples, we will
use a simple dataset consisting of five variables and
four records.
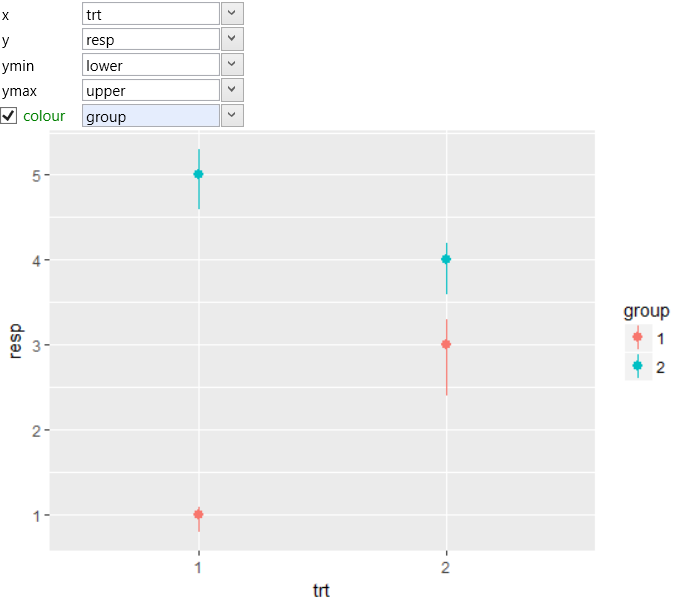
We map to the x axis the trt variable. The y, ymin and ymax
ranges we map to the resp, upper and lower variables.
Finally, we map the color aesthetic to the group variable.
The result is shown in the following plot.
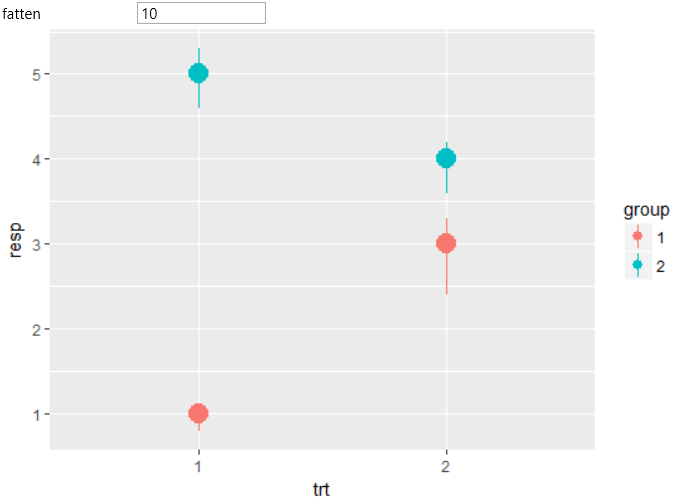
You can adjust the point size using the fatten parameter.
In the following plot, we set this property to 10.