geom_rug
Rug plot is a compact visualization designed to supplement a
2D display with the two 1D marginal distributions. Rug plots
display individual cases so are best used with smaller datasets.
Aesthetics
Other Properties
| sides |
controls which sides of the plot the rugs appear on |
Description and Details
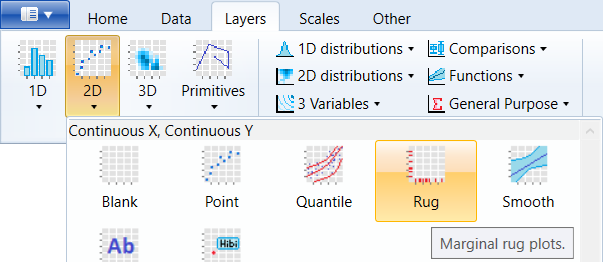
Using the described geometry, you can insert a geometric
object into your data visualization – marginal lines that
are defined by one positional aesthetic property. You can
find this geometry in the ribbon toolbar tab Layers, under
the 2D button.
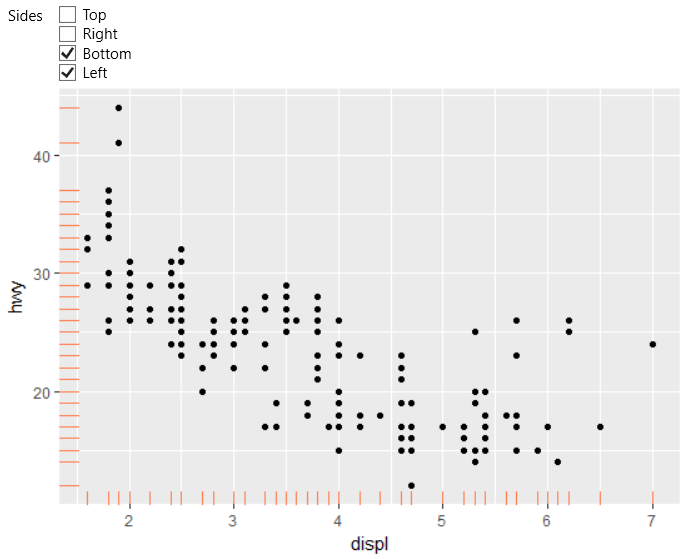
The definition of geom_rug is very simple. We define
positional aesthetic parameters (x and y) and choose
the plot sides on which we want to see the marginal
lines. You can display them on one or more sides (top,
right, bottom and left). The example is shown in the
following plot.
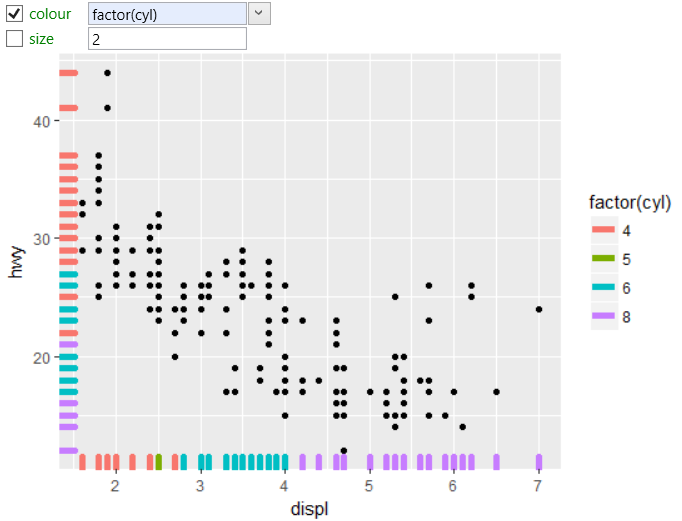
As with other geometries, you can work with several
aesthetic properties. The following graph shows an
example, where we set directly the thickness of marginal
lines and we mapped the color property to cyl variable
from the dataset.