 geom_text
Adds text layer directly to the plot.
Aesthetics
| x, y |
required position aesthetics |
| label |
aesthetic that defines rendered text |
| alpha,
angle,
colour,
family,
font face,
group,
hjust,
vjust,
line height,
size |
classic aesthetics properties |
Other Properties
| parse |
If TRUE, the labels will be parsed into expressions and displayed as described in plotmath |
| nudge_x, nudge_y |
Horizontal and vertical adjustment to nudge labels by. Useful for offsetting text from points, particularly on discrete scales |
| check_overlap |
If TRUE, text that overlaps previous text in the same layer will not be plotted |
Similar Geometries
geom_label
Description and Details
Using the described geometry, you can insert a simple text layer
into your data visualization that is defined by a positional
aesthetic properties x, y and label (displayed string). You
can find this geometry in the ribbon toolbar tab Layers, under
the 2D button.
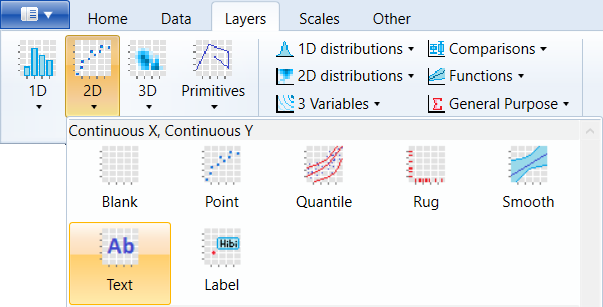
Text layers you can add using two geometries, namely geom_text
and geom_label. To insert a text layer into a graph, you
need to define the positional aesthetic parameters x, y and
the dataset variable that contains the text that you want
to insert into the graph. An example of the geom_text layer
inserted in the chart is shown in the following figure. We
used the built-in mtcars dataset. The position of text
strings was defined using the wt and mpg variables and as
the text we display the row names from selected dataset.
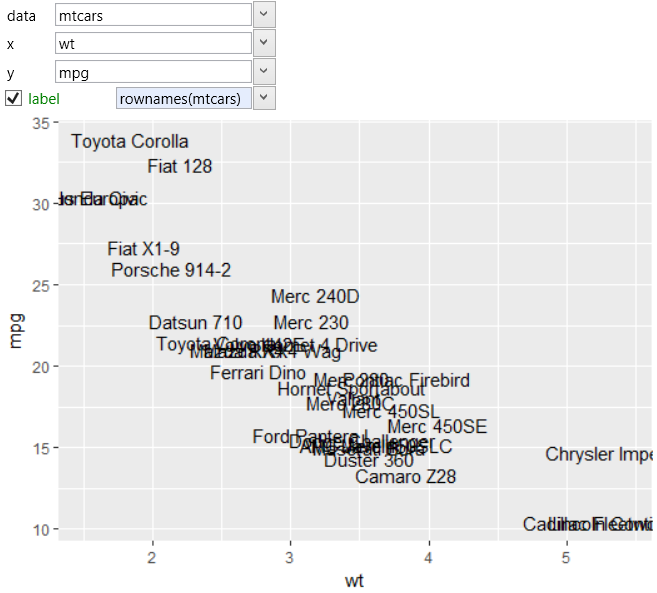
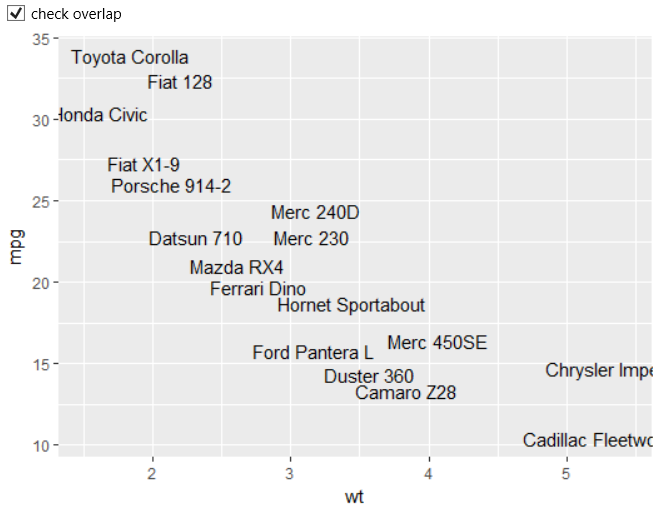
The text layer in graph is not well-readable due to intense
text overlapping. If you want to see only labels that are
not overlapped, you can do it through the check overlap property.
If the check overlap check-box is set to TRUE, only
non-overlapped labels will be displayed. If FALSE is set, all
labels will be drawn. An example of a non-overlapped labels
display is shown in the following figure.
As with other geometries, you can define a text layer with
several aesthetic properties. The individual aesthetic
properties are described in detail in separate chapters.
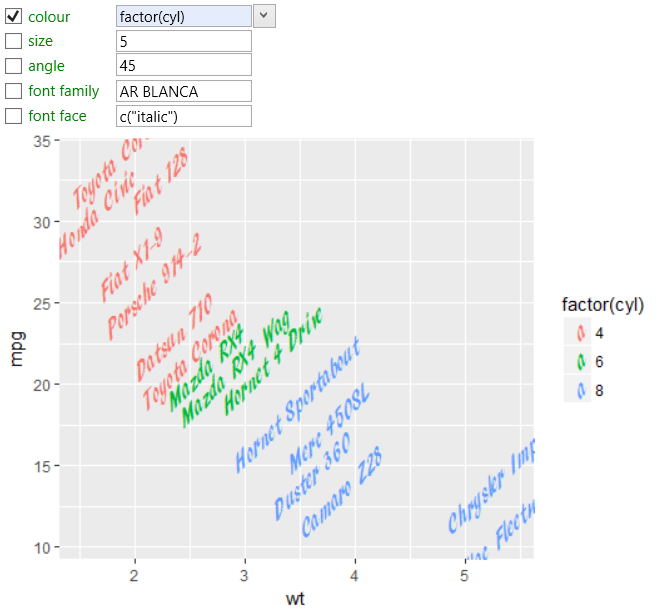
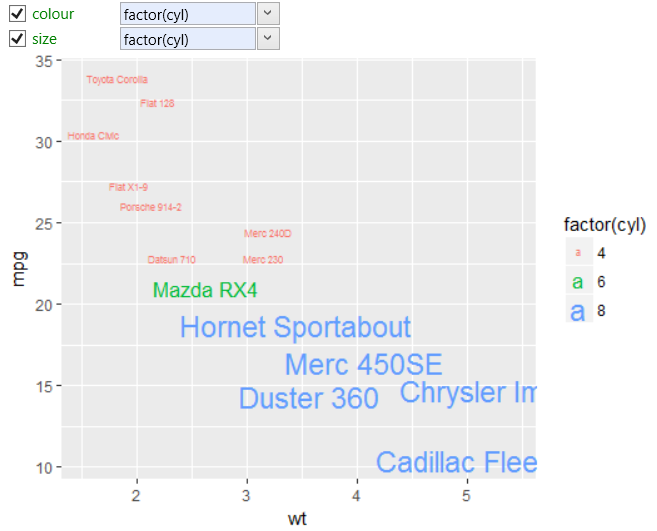
An example of working with the aesthetic properties is
shown in the following plot. The same aesthetic properties
can also be used for geom_label. In the following plot, we
mapped the label color to the cyl dataset variable. Other
parameters we have defined using static values – size,
rotation, font family and font face.
If we map multiple aesthetic properties in the same way,
legends for all aesthetics will be unified into one. In
the following example, the cyl variable was mapped to the
color and size property.
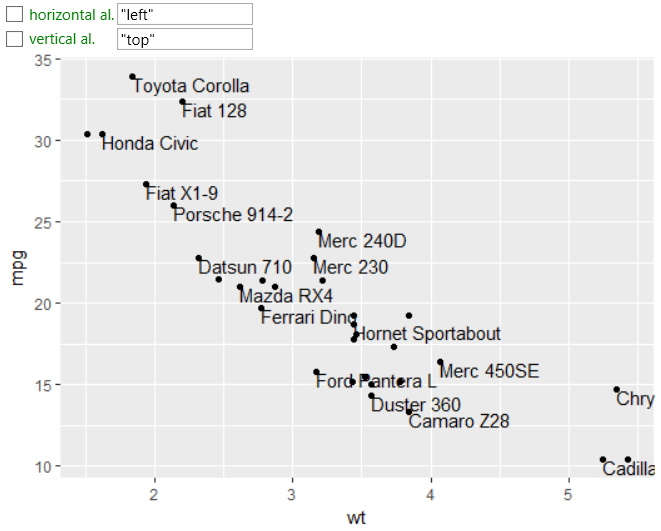
Your text labels are positionally defined by two coordinate
values (x and y). By default, individual labels are centered
to this coordinate. Using the horizontal and vertical
alignment you can set label alignment. The following
illustration shows an example where individual labels were
aligned horizontally to the left and in vertical direction
to the top. For aligning, you can also use special types –
inward and outward. Detailed description can be found in
separate chapter.
Sometimes it becomes necessary to display a more specific
label types, for example, complex formulas. Formulas can
be in text layers defined using mathematical annotations.
In this case, we put to label property mathematical expression
that will be interpreted and formatted according to TeX-like
rules.
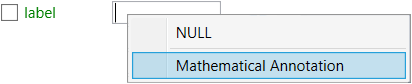
Using this expression, you can also insert very complex forms
of equations into the chart. This expression is not quite
simple for beginners. That's why in Stagraph was created a
help dialog for mathematical expressions definition. Dialog
you can display form the context menu if you click on the
Mathematical Annotation… item.
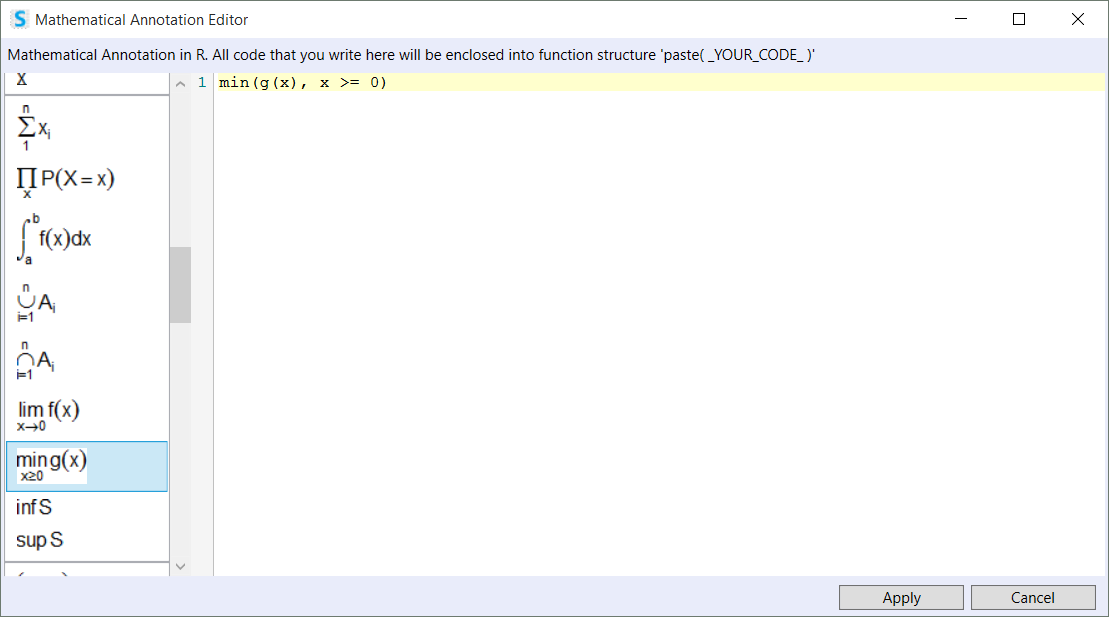
The dialog will appear as in the following figure. On the left is
a list of equation examples that you could use. After double-click
on the selected one, it is inserted into a script editor that
contains features such as syntax highlighting or code autocompletion
(for mathematical annotations). In the script editor, you can
combine multiple equations from the list and finalize into the
required form. If your equation is complete, press the Apply
button and your R script will be inserted into the label aesthetic
property text-box.
You can define as a static equation that will be the same for all
cases or dynamic where we combine a static definition with dataset
variables. The example is displayed in the following graph.
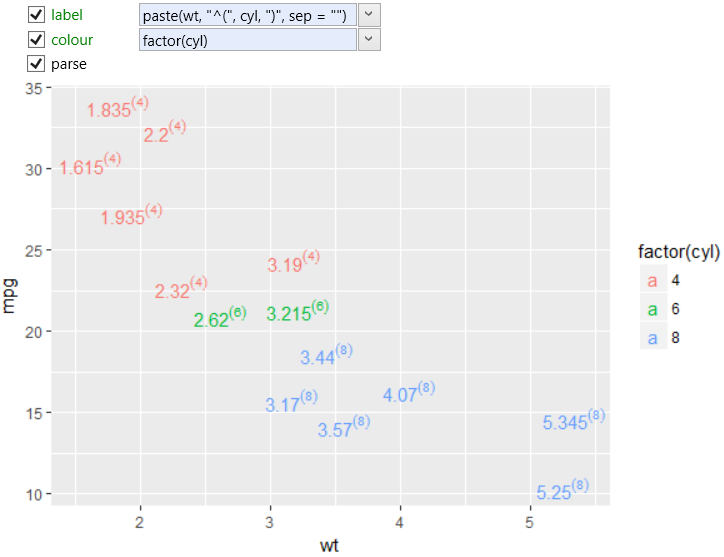
In this case, we mapped positional aesthetics to the wt and mpg
variables. The label was created as a combination of two variables
in the form of equation wt(cyl). In this way, you can create
very complex forms of text layers.
In a similar way (mathematical expressions) you can define
text descriptions for legend, axis or plot title. More about these
options will be discussed in the chapters that will be dedicated
to individual data visualization object.