 geom_map
geom_map creates pure annotation (polygons) that does not
affect position scales.
Aesthetics
Other Properties
| map |
dataset that contains the map coordinates.
Dataset must contain columns x or long, y or lat, and region or id |
Similar Geometries
geom_polygon
Description and Details
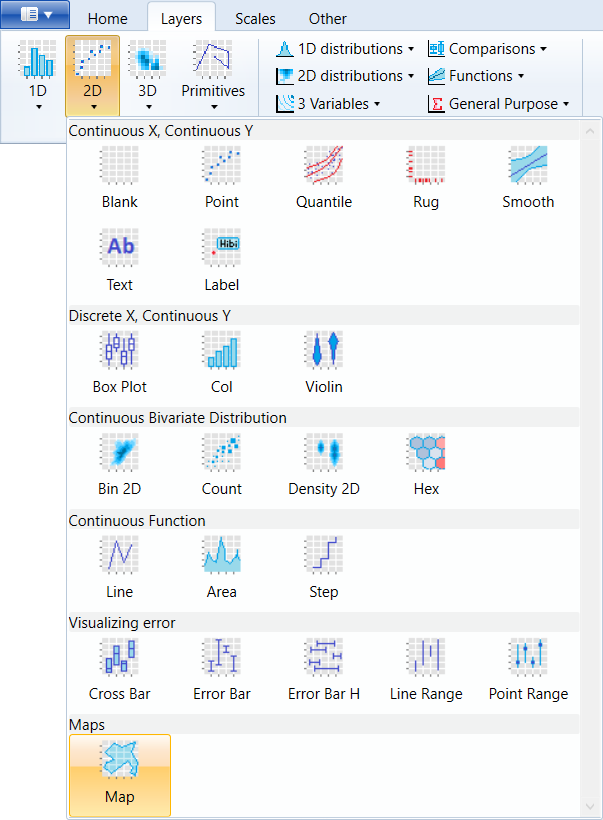
Using the described geometry, you can insert a geometric
object into your data visualization – a map annotation layer.
You can find this geometry in the ribbon toolbar tab
Layers, under the 2D button.
If you want to use geom_map layer, you need two datasets.
One contains geometric data (e.g. coordinates of countries
borders) and the other dataset contains the values you want
to display in this geometry (e.g. population). So the
structure is similar to the shape files (shp and dbf files).
Using the Custom Dataset feature we create dataset named crimesm.
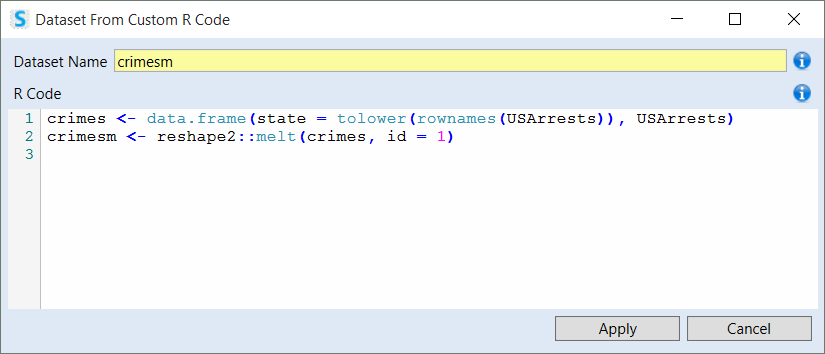
This dataset contains statistics about arrests per 100,000
residents for assault, murder and rape in each of the 50 US
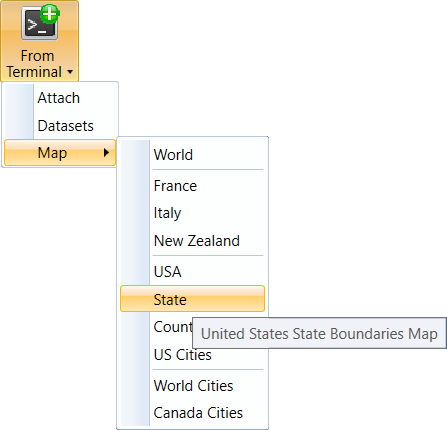
states in 1973. If we want to display these data on the map,
we import into the Stagraph other built-in dataset that
contains map coordinates of all US States. The dataset is
included in the maps package and we import it through the
ribbon button From Terminal – Map – State.
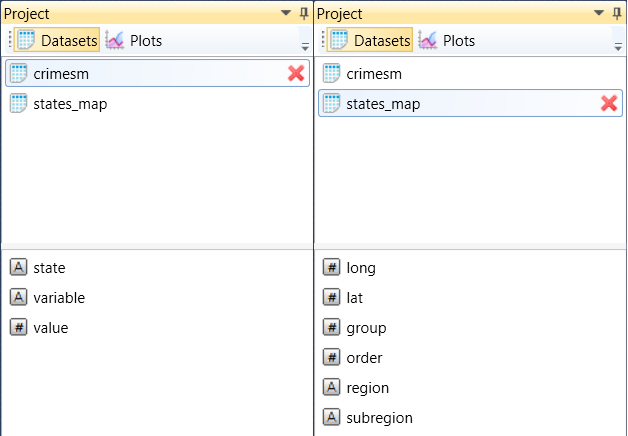
Finally, we have both datasets imported into the program.
Information about violent crime rates are in dataset stored
in the long format. Dataset contains variables state, variable
and value. The map is stored in the states_map dataset and
contains coordinates (long & lat variables), group identifier
and other region information.
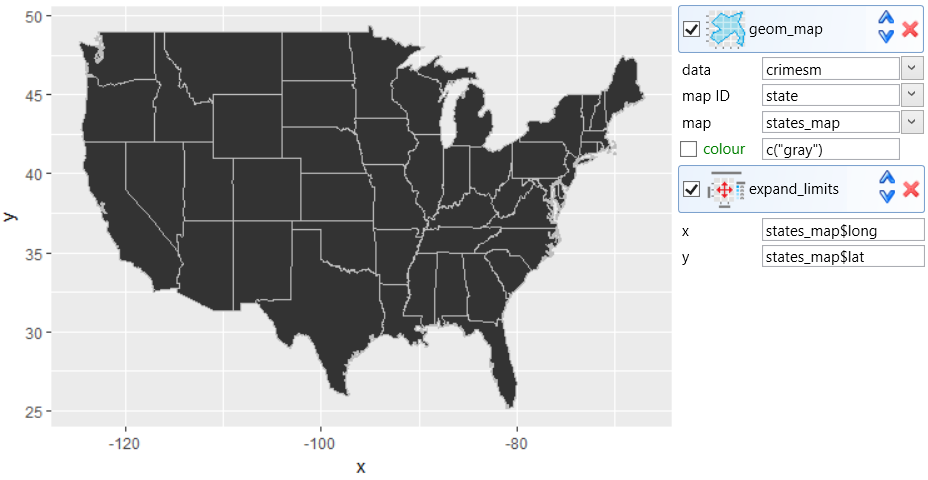
At first, we create a map in the graph using the geom_map
geometry layer. We set the data parameter (the dataset that
contains the variable you want to Plot), map_id (variable
from dataset in the data property that identifies individual
states) and the dataset that contains the map itself (map
property). For states border, we set the color aesthetic
property to gray. Since the coordinate system of plot is not
created by the geom_map layer automatically, we have to create
them. For this purpose, we used the expand_limits object, which
defines axis ranges by the long and lat variables. The final
result is shown in the following plot.
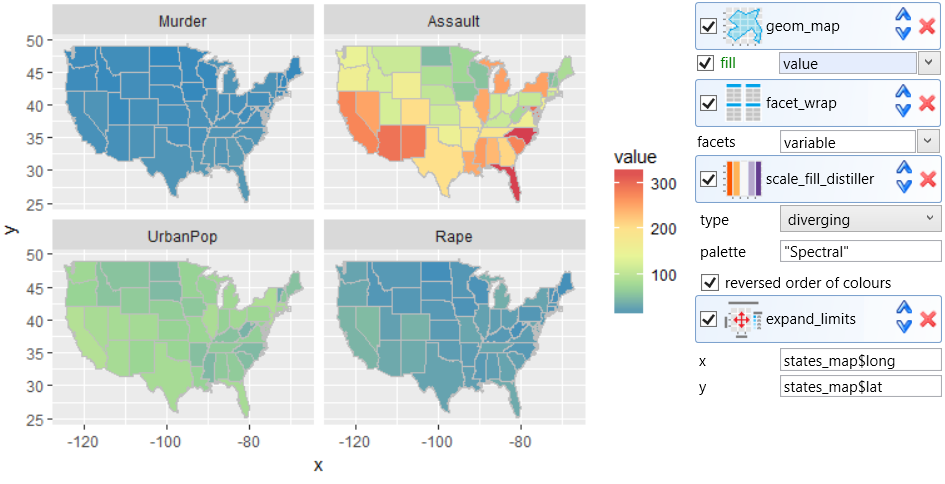
In the next step, we Plot the numeric values from the
crimesm dataset on displayed map. To display the values, we
map the fill aesthetic property to the value variable. We
know that this variable contains values of four categories
for each state (murder, assault, urbanpop and rape), so we
will display them in individual sub-plots using the facet_wrap
object. At last, we change the fill scale using the
scale_fill_distiller object. Using this object, we setup
Diverging – Spectral color palette.
You can also create a similar map using the geom_polyon
layer. In this case, however, the variables of both datasets
must be merged into one in a long format.