 geom_polygon
The geom_polygon geometry layer is very similar to
geom_path, except that the start and end points are
connected and the inside is colored by fill aesthetic
property.
Aesthetics
Similar Geometries
geom_path,
geom_map
Description and Details
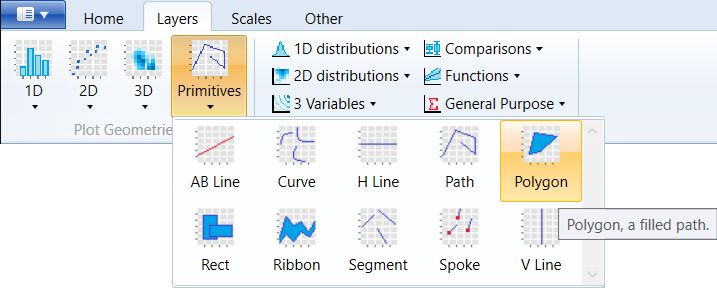
Using the described geometry, you can insert a geometric
object into your data visualization – layer of polygons
that are defined by two positional aesthetic properties –
x and y. You can find this geometry in the ribbon toolbar
tab Layers, under the Primitives button.
The geom_polygon is a relatively simple type of geometry
that is defined by small number of properties. We need to
define the variables that contain the vertex coordinates
of individual polygons and polygon border / fill color.
As an example, we use the built-in world map dataset from
the maps package. The coordinates are in dataset stored
in the long and lat variables. After mapping the positional
aesthetic properties to these variables, the resulting
visualization will look like in the following figure.
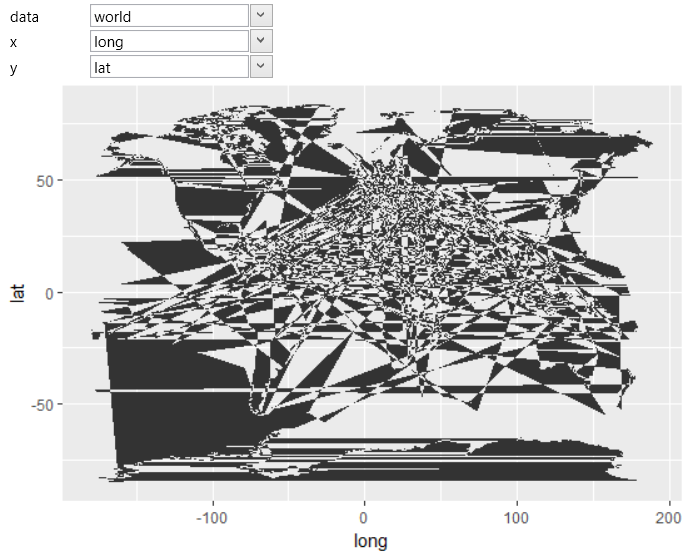
From the result we see that the map does not look "as expected",
because all the individual countries polygons are joined into one
polygon. This is because we did not tell the program how to
identify individual polygons among themselves. As the polygons
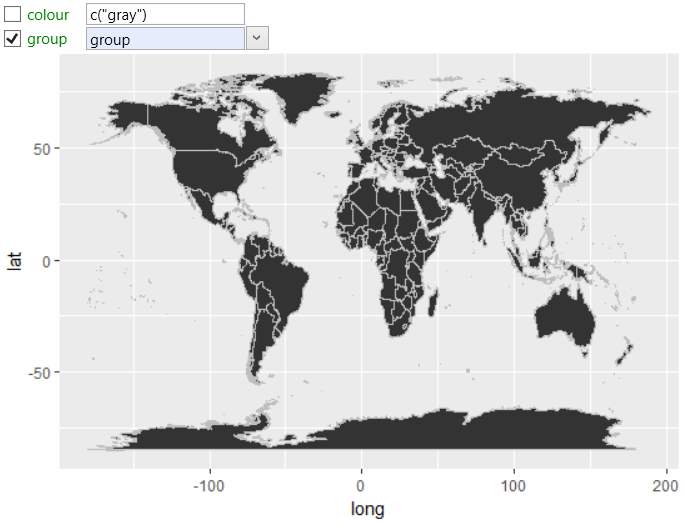
identification is in dataset used the group variable. For correct
polygons display, we must map the group variable to the group
aesthetic property. Based on this setting, the program knows how
to divide the polygons and the result will be as in the following
figure.
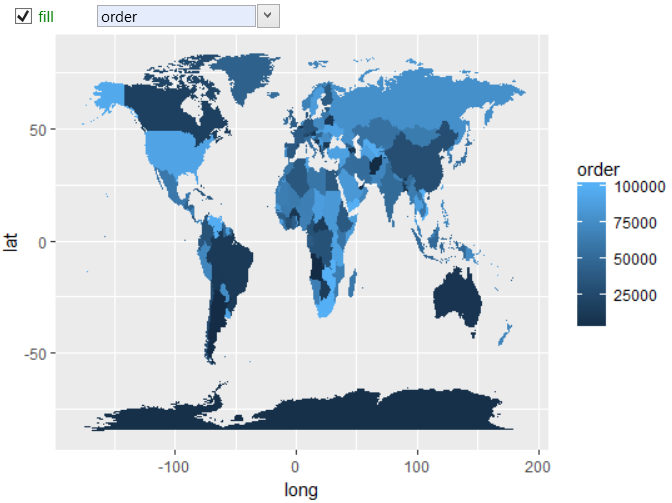
The aesthetic properties do not just have to be set to static
values, but we can map them to selected dataset variables. In
the next graph, we mapped the fill property to a numeric variable
– order. As a result, the individual countries polygons are
colored according to a continuous fill scale.
If you want to display more information on this map
(e.g. income or number of inhabitants), you must to
combine these datasets into one or you can use geom_map
layer. In addition, you can notice that the coordinate
system is in map distorted. Stagraph allows you to use
the map projection and for this purpose we use objects
from the coord group.