 geom_contour
Using geom_contour allows you to Plot 3D surfaces in 2D
plot. To be a valid surface, the data must contain only a single
row for each unique combination of the variables mapped to the x
and y aesthetics. Contouring tends to work best when x and
y form a (roughly) evenly spaced grid. If your data is not evenly
spaced, you may want to interpolate to a grid before visualizing.
Aesthetics
Computed Variables
Similar Geometries
geom_density2d,
geom_line,
geom_bin2d
Description and Details
Using the described geometry, you can insert a simple
geometric object into your data visualization – a contours
defined by a position aesthetic properties x, y and z.
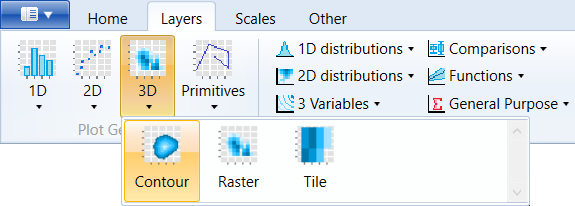
You can find this geometry in the ribbon toolbar tab
Layers, under the 3D button.
geom_contour serves to display 3D surfaces in 2D space using
contour lines. However, if you want to use this geometry, your
dataset must have a specific form. In the space must your
dataset form uniform grid. An example of such grid is displayed
(with the point geometry) in the following figure.
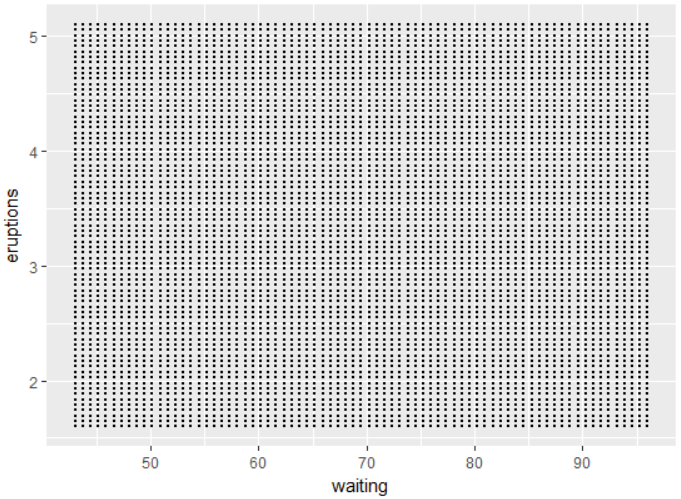
The individual points are evenly spaced. If we create
geom_countour based on these data, the result will look
similar to the following visualization.
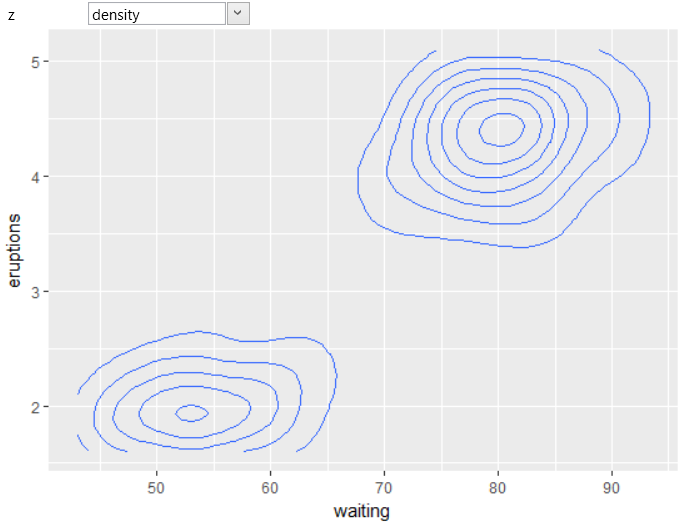
The individual contour lines essentially connect locations
in the 2D space with the same value of the z parameter. As
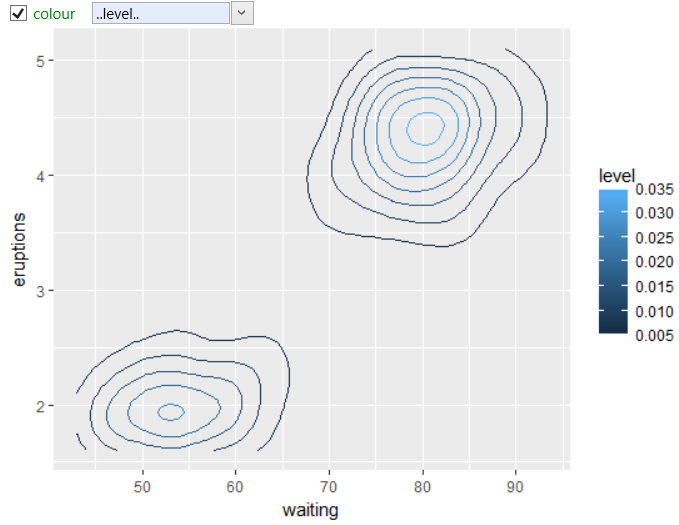
in other cases, you can also use Computed variables that
are related with selected statistical transformation. For
geom_contour there is one computed variable – level. In
the following example, we used this variable to define the
color aesthetic of contour lines.
Most often, we use this geometry layer for surfaces imaging –
DEM (digital elevation model). This DEM can be imported directly
from several GIS file formats into the program. If you want to use
this geometry for irregularly spaced points, you can use the R
runtime functionality and interpolate these data. For example,
you can use the Akima
package. In this case, however, you do not
avoid typing the R code in the built-in console.