geom_curve
Draws a curved line. See the underlining drawing function
curveGrob for the parameters that control the curve.
Aesthetics
Other Properties
| curvature |
a numeric value giving the amount of curvature. Negative values produce left-hand curves, positive values produce right-hand curves, and zero produces a straight line |
| angle |
a numeric value between 0 and 180, giving an amount to skew the control points of the curve. Values less than 90 skew the curve towards the start point and values greater than 90 skew the curve towards the end point |
| ncp |
the number of control points used to draw the curve. More control points creates a smoother curve |
| arrow |
specification for arrow heads, as created by arrow |
| lineend |
line end style – round, butt, square |
Similar Geometries
geom_segment,
geom_path,
geom_line
Description and Details
Using the described geometry, you can insert a simple geometric
object into your data visualization – a curved line that is defined
by positional aesthetic properties x, y, xend and yend. You can
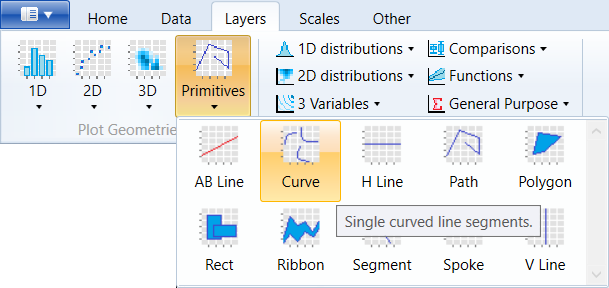
find this geometry in the ribbon toolbar tab Layers, under the
Primitives button.
Using the described geometry, it is possible to add curved
lines to your data visualization. These curves are defined
by a pair of start and end point coordinates. The curve
character itself is defined by the auxiliary parameters.
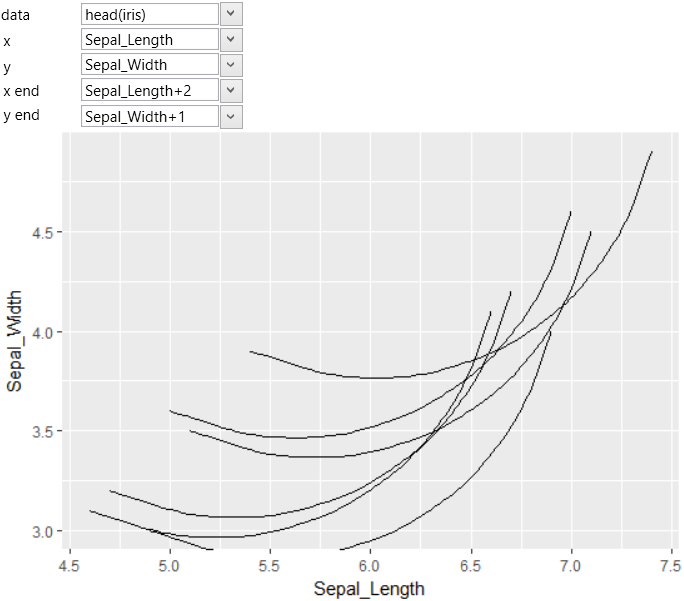
For the following example we will use the iris dataset.
Using the head() function, we choose the first 6 records.
We defined the starting point of curves using the Sepal_Length
and Sepal_Width variables. The end points were created by
moving the start points to a constant value. The result
is shown in the following figure.
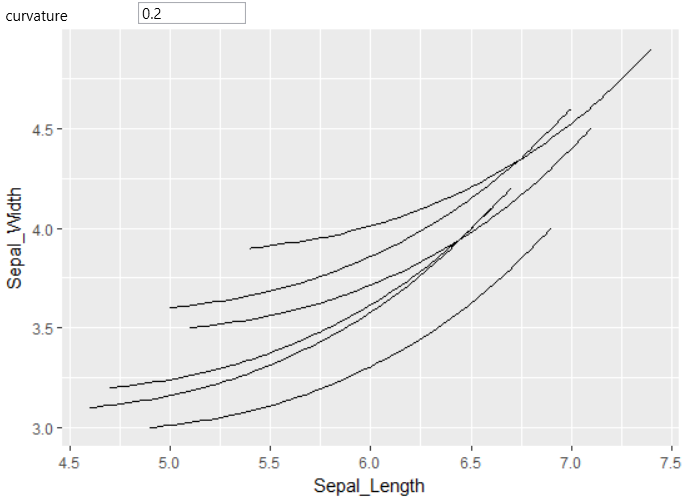
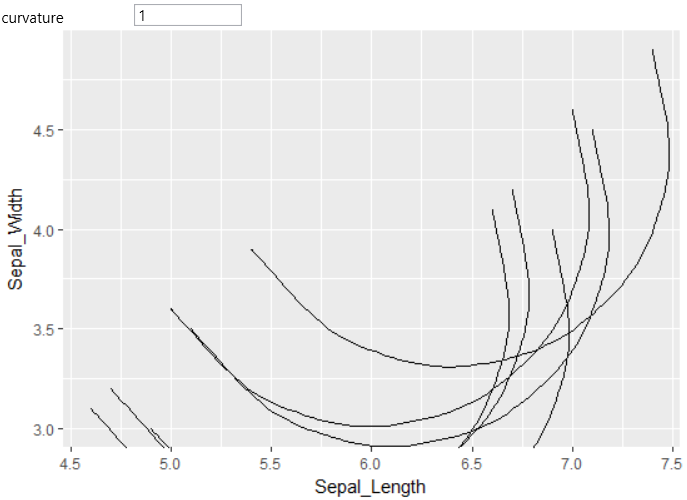
The curvature size is defined by the curvature property.
By default, the value is set to 0.5. If the value is reduced
to 0.2, the curvature will be lower. The example is in
the following plot.
Another example in the following figure shows an increase of
the curvature after increasing the value of described parameter.
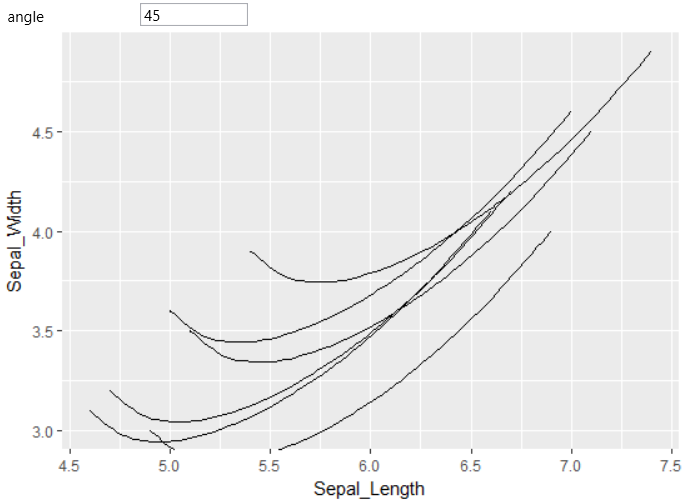
Another auxiliary parameter is angle. It is numeric value in
the range from 0 to 180 that giving an amount to skew the
control points of the curve. Values less than 90 skew the
curve towards the start point and values greater than 90
skew the curve towards the end point. An example of an altered
value is shown in the following graph.
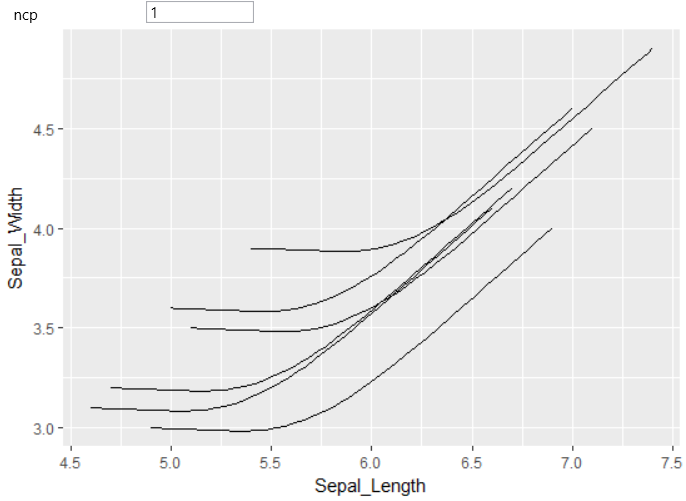
Another helper parameter that you can set is ncp. This parameter
defines the number of points used to draw the curve. More
control points create a smoother curve. The example is shown
in the following figure.
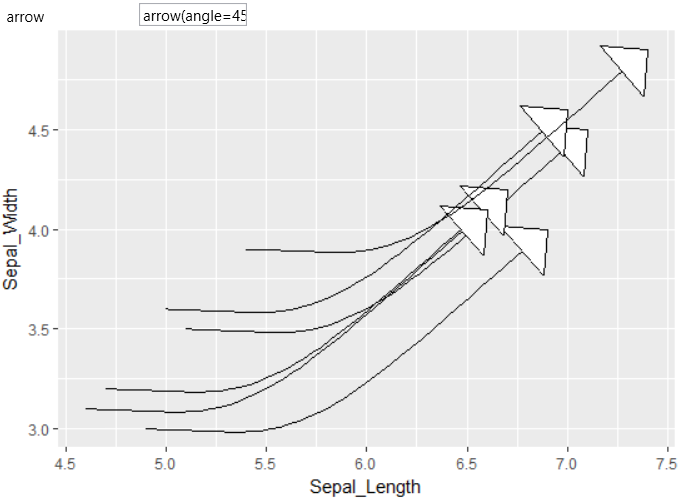
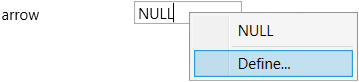
For curves, you can use the next parameter to define arrow
heads. For this purpose – the arrows generation is used R
function arrow, which contains several arguments. This is
a more complicated function and the program offers a helper
dialog that makes it easier to define arrow heads. This
dialog will be displayed if you click on the Define… item
in contextual menu.
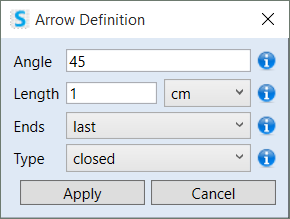
The displayed dialog contains four parameters that you can
setup. You can define the angle of arrow head, its length
in selected units, type and finally if the arrow head will
be drawn at the beginning or end of the curve.
In the following example, we added arrow heads to the curves
that are defined in the previous dialog.