 geom_raster
geom_raster is a layer for high performance rectangles
rendering when all the cells are the same size.
Aesthetics
| x, y |
required position aesthetics |
| alpha,
fill |
classic aesthetics properties |
Other Properties
| interpolate |
if TRUE interpolate linearly, if FALSE – the default don't interpolate |
| hjust, vjust |
horizontal and vertical justification of the grob. Each justification value should be a number between 0 and 1. Defaults to 0.5 for both, centering each pixel over its data location |
Similar Geometries
geom_rect,
geom_tile,
geom_polygon
Description and Details
Using the described geometry, you can insert a geometric object
into your data visualization – raster layer that is defined by
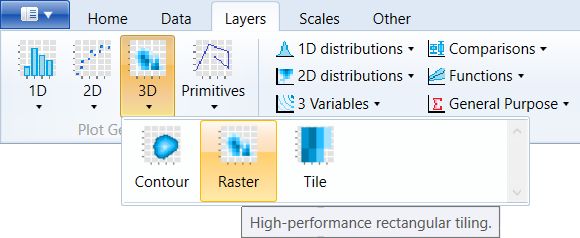
two positional aesthetic properties – x and y. You can find
this geometry in the ribbon toolbar tab Layers, under the 3D button.
If you want to create a layer composed of squares, you can use
geom_raster, geom_rect or geom_tile layer. The result of these
geometries may look identical, but their definition is
significantly different. If you need to draw rectangles very
quickly and they have the same height and width, you can use
the geom_raster layer. This geometry is defined by positional
characteristics – x and y. From other aesthetic properties,
you can work only with the alpha and fill aes.
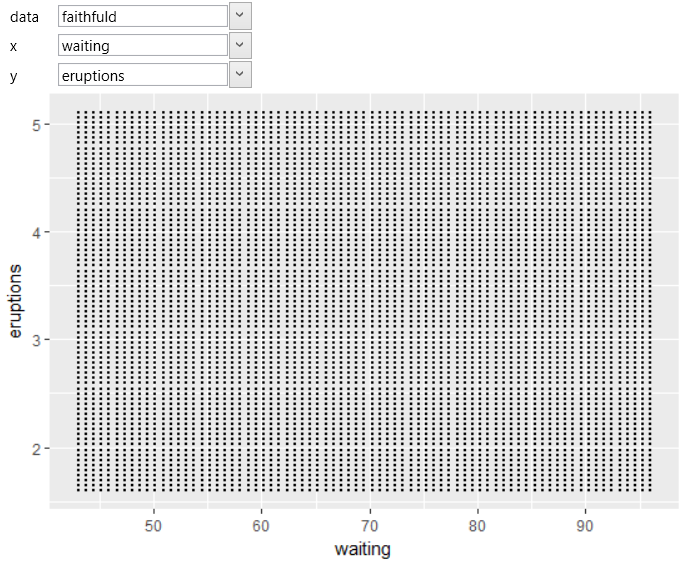
We will show an example of use with the built-in faithful
dataset. As positional variables we choose the waiting and
eruptions variables. If we display these variables using
the geom_point geometry, you will see that they represent
a uniform grid. The example is shown in the following figure.
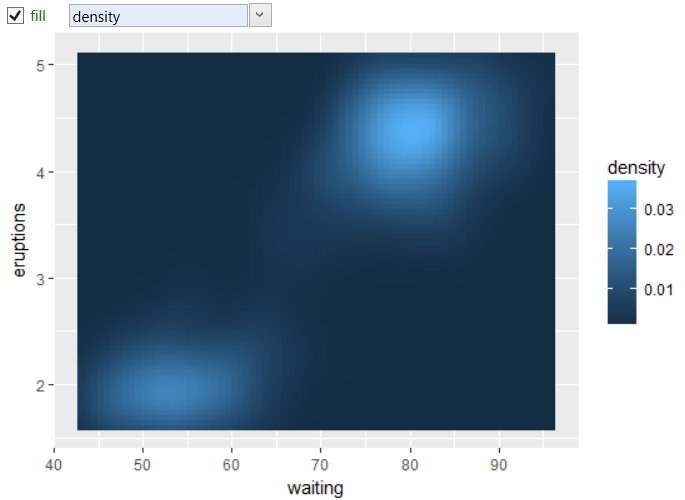
If we apply the geom_raster to this dataset, we must define
also the fill aesthetic. For the fill aes we used the density
variable. The result is shown in the next plot.
In addition to the described properties, you can set also
the Interpolate check-box. If is set to FALSE, the raster
geometry will be displayed "as is". If TRUE, individual
rectangles will be interpolated and the fill will be in the
visualization smoother.