 geom_rect
geom_rect is a geometry layer for rectangles drawing which are
defined by four corners (xmin, xmax, ymin, ymax).
Aesthetics
Similar Geometries
geom_raster,
geom_tile,
geom_polygon
Description and Details
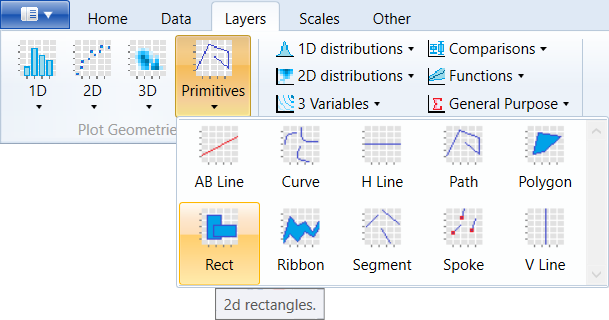
Using the described geometry, you can insert a geometric
object into your data visualization – layer of rectangles
that are defined by four positional aesthetic properties –
xmin, xmax, ymin, ymax. You can find this geometry in the
ribbon toolbar tab Layers, under the Primitives button.
We can add rectangles into data visualization through three
geometry layer types – geom_raster,
geom_tile and geom_rect.
Each geometry type is defined in a different way. In this
section, we describe the definition of geom_rect layer in a
simple example. The squares are defined by coordinates of
four corners – xmin, ymin, xmax, ymax. Geometry can be mapped
to the selected dataset variables or you can set it directly
by inserting static coordinates. In the following example,
we'll show how to define the geom_rect layer directly by
coordinates entering. If you set coordinates directly, leave
the data property blank. Into the positional properties we
add coordinates of two rectangles in the form of vectors
(through the c()
function). Finally, we define the fill
property in the same way – we enter two colors in the vector.
The result is shown in the following chart.
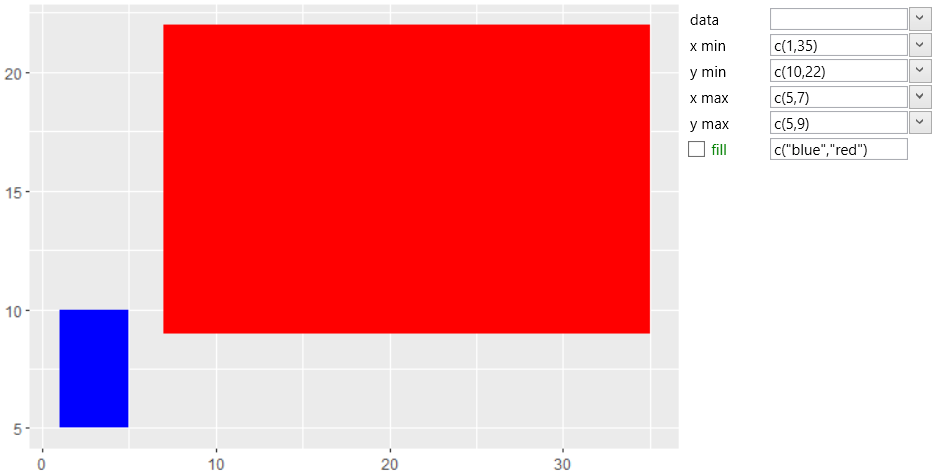
This is a very simple example where we define static values.
In addition to this approach, you can map these properties
to variables from the selected dataset.