geom_segment
Draws a straight line between point coordinates (x, y) and (xend, yend).
Aesthetics
Other Properties
| arrow |
specification for arrow heads, as created by arrow |
| lineend |
line end style – round, butt, square |
Similar Geometries
geom_curve,
geom_path,
geom_line
Description and Details
Using the described geometry, you can insert a simple
geometric object into your data visualization – a line
segments layers that is defined by a position aesthetic properties
x, y, xend and yend. You can find this
geometry in the ribbon
toolbar tab Layers, under the Primitives button.
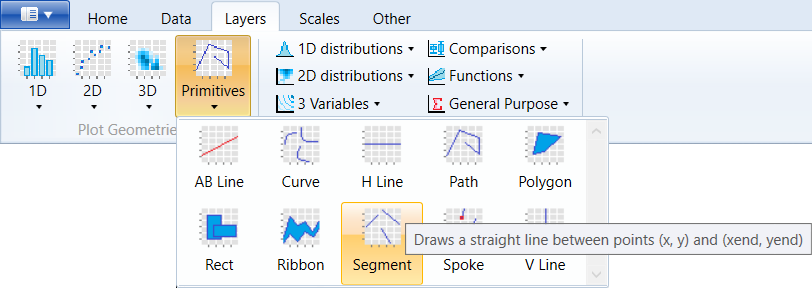
Geometry layer geom_segment is used to create line segments
that are positionally defined by the initial (x, y) and the
final coordinate (xend, yend). The following figure shows a
very simple example. We used a selection from the built-in
iris dataset. As the starting points we use Sepal_Length
(x-axis) and Sepal_Width (y-axis) variables. We used the same
variables to define endpoints, which we moved to a constant
value (1). The result is shown in the following figure.
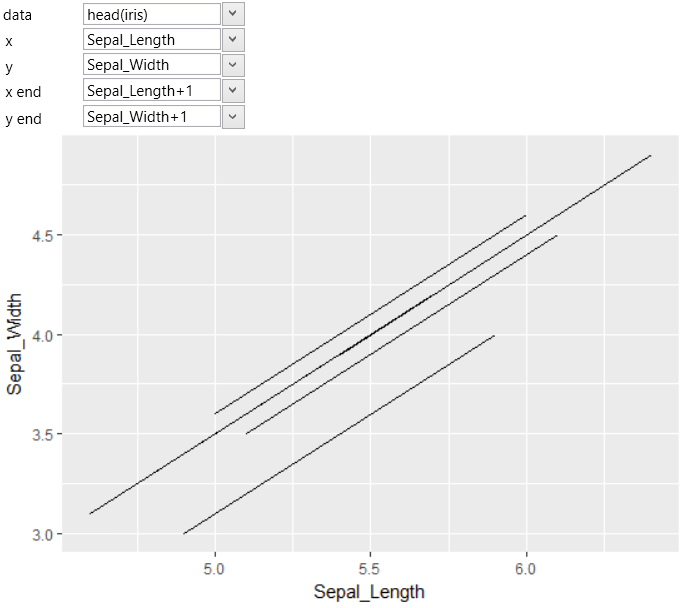
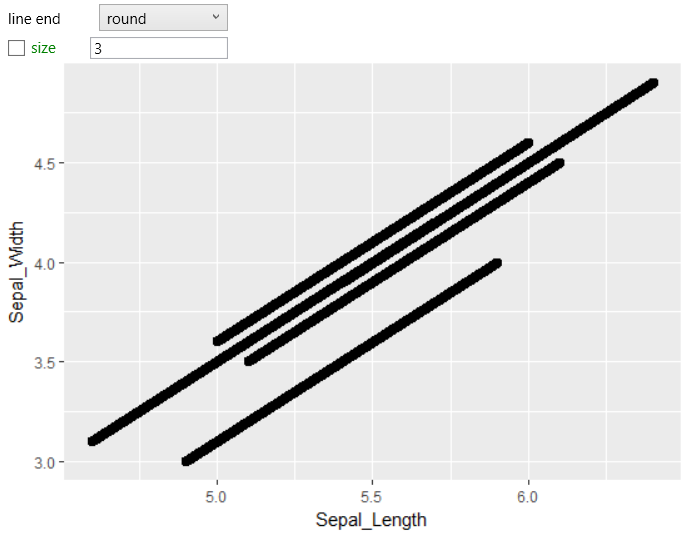
The program has generated several simple lines according to
defined parameters. Using the other aesthetics properties,
you can change the visual character of line segments. These
parameters can be set or mapped to selected variables from
the dataset. The following figure shows an example of a
line thickness (size aes) and line end settings.
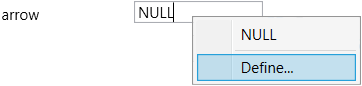
In the Properties section, you find one specific parameter
named arrow. Using this property, you can define the arrow
head at the beginning or end of each line segment. This
property is defined as the R function – arrow() with multiple
arguments. The dialog for setting these arguments can be
found in the context menu under the Define… item.
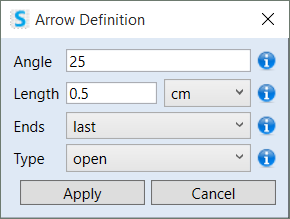
In this dialog you can set the arrow head angle, length, type
and also you can define whether the arrow head will be placed
at the beginning or end of the line segment.
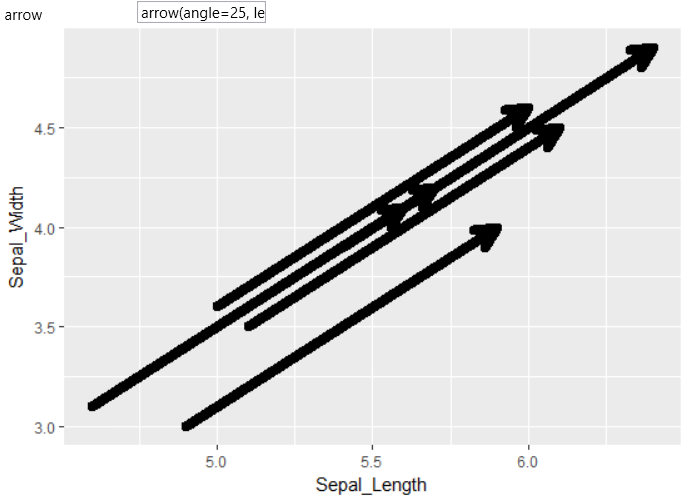
An example of line segments with arrow heads is shown in the
following plot.
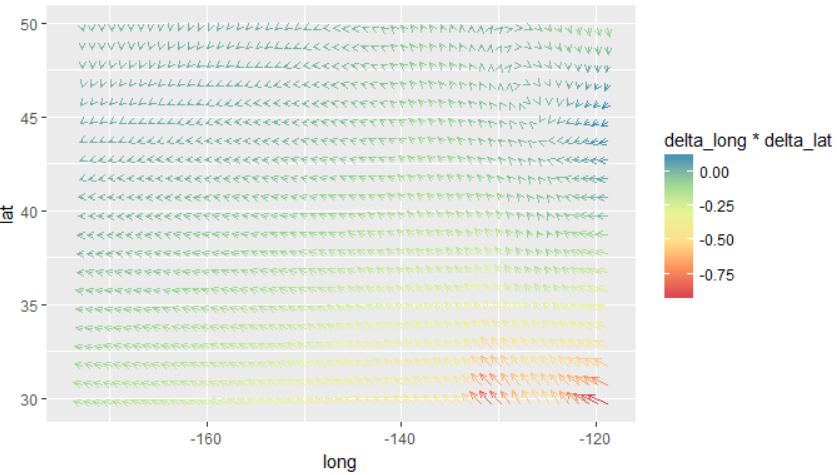
Using the described geometry, you can create relatively impressive
data visualizations. The example is shown in the following data
visualization. In this case, we have created a large number of
line segments, which are defined by the start coordinate (lat, long)
and with shifted end coordinate (lat + delta_lat,
long + delta_long). The color aesthetic property we mapped
to a function that is based on the delta_lat * delta_long
variables. Similar visualizations are often used in the
field of environmental sciences or geosciences. A similar
type of visualization (defined differently) can be created
using geom_spoke geometry.