geom_step
geom_step creates a staired plot, highlighting
exactly when changes occur.
Aesthetics
Similar Geometries
geom_line,
geom_path
Description and Details
Using the described geometry, you can insert a simple geometric
object into your data visualization – a line steps that are
defined by positional aesthetic properties. You can find this
geometry in the ribbon toolbar tab Layers, under the 2D button.
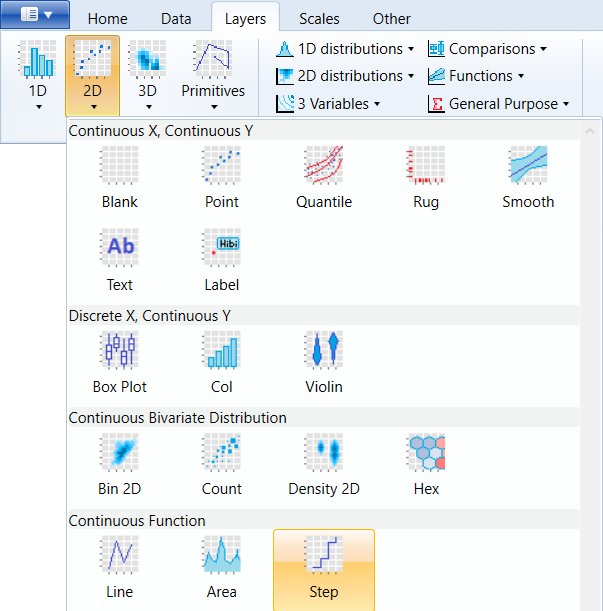
If you want to create stairs plot, use the geom_step geometry.
Lines are defined for this geometry by two positional aesthetic
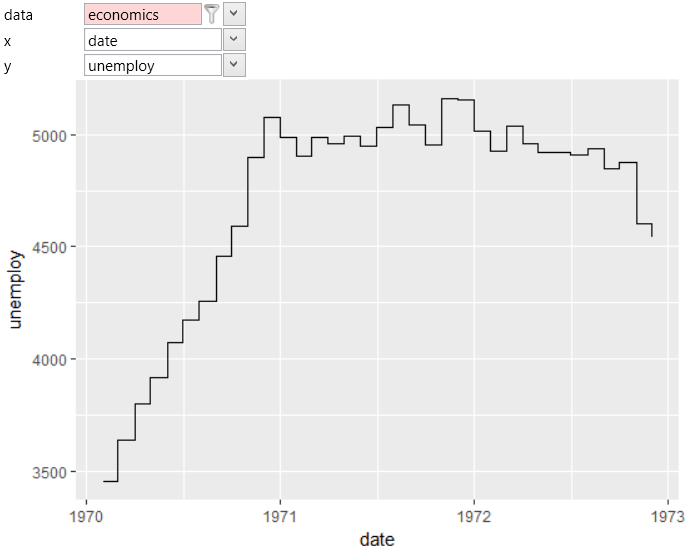
properties – x and y. For the next example, we’ll use the
built-in dataset economics, from which we’ve selected the first
three years. Subsequently, we mapped the date and unemployment
variables. The result is shown in the following plot.
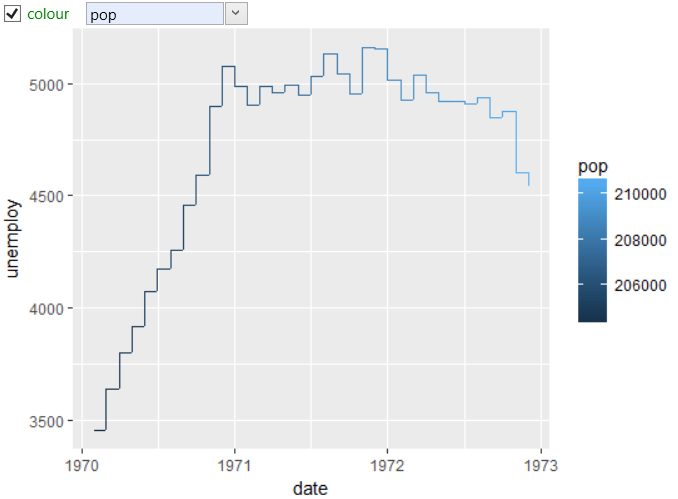
As in other cases, you can work with multiple aesthetic
properties. The following graph shows an example, where
we mapped the color property to the pop dataset variable.
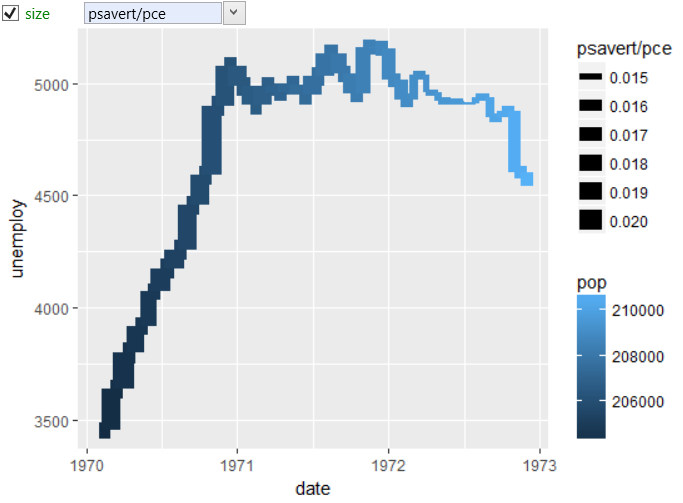
Finally, we can also define the line thickness. We mapped
the size property to a function composed of two variables
psavert/price. The result is shown in the following visualization.