 geom_tile
geom_tile is geometry layer for rectangles rendering which
are defined by the center of rectangle and by its size
(x, y, width, height)
Aesthetics
Similar Geometries
geom_rect,
geom_raster,
geom_polygon
Description and Details
Using the described geometry, you can insert geometric object
into your data visualization – layer of rectangles that are
defined by two positional aesthetic properties – x and y and
by two size properties – width and height. You can find this
geometry in the ribbon toolbar tab Layers, under the 3D button.
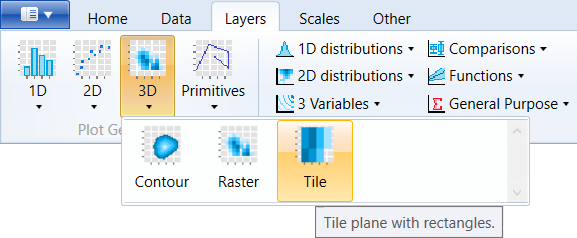
You can add rectangles into the data visualization using
three types of geometry layers – geom_raster,
geom_rect and geom_tile.
Each of these layers is defined in a different
way. geom_tile is defined by the coordinate of rectangle
center and by its width and height. You can manually set
these parameters or map to selected dataset variables.
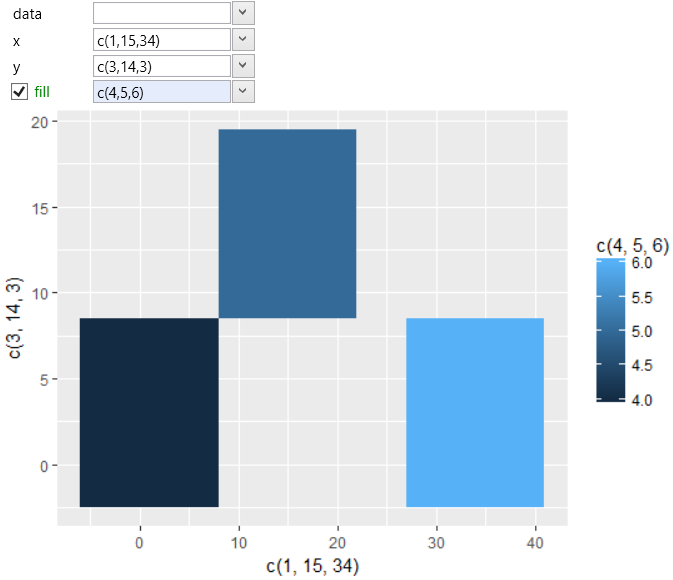
The example is shown in the following figure. In this case,
we’ve created three squares using three center coordinates.
The fill aesthetic property was defined as the array of
numerical values. The program rendered a tile layer and
since we have not defined the size properties, automatically
has been set to fill all available space.
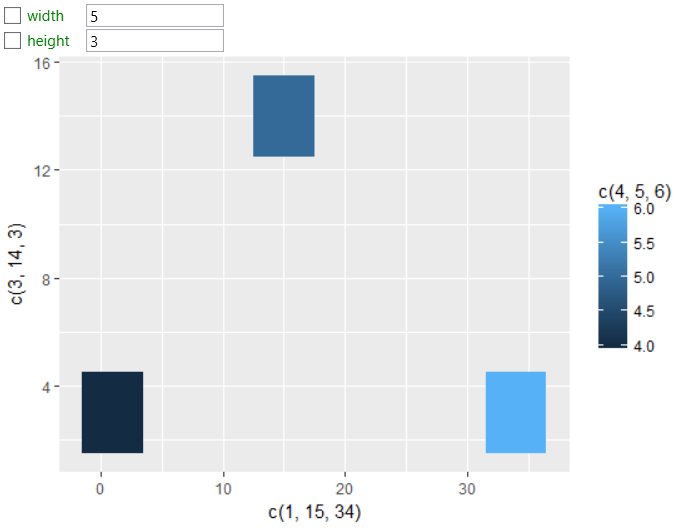
Tiles width and height you can define as well as their coordinates.
You can set these properties as a constant value for all tiles
or individually. In the following plot, we've set constant value
for all of the squares at once.
The previous examples shown how the geom_tile layer can be
directly set. The second option is to map individual aesthetic
properties to selected variables from the dataset.