geom_count
geom_count is a variant of geom_point that counts the number of
observations at each location, then maps the count to point area.
It is useful when you have discrete data with overplotting.
Aesthetics
Computed Variables
| n |
number of observations at position |
| prop |
percent of points in that panel at that position |
Similar Geometries
geom_density2d,
geom_hex,
geom_point,
geom_bin2d
Description and Details
Using the described geometry, you can insert a simple geometric
object (points) into your data visualization that is defined by
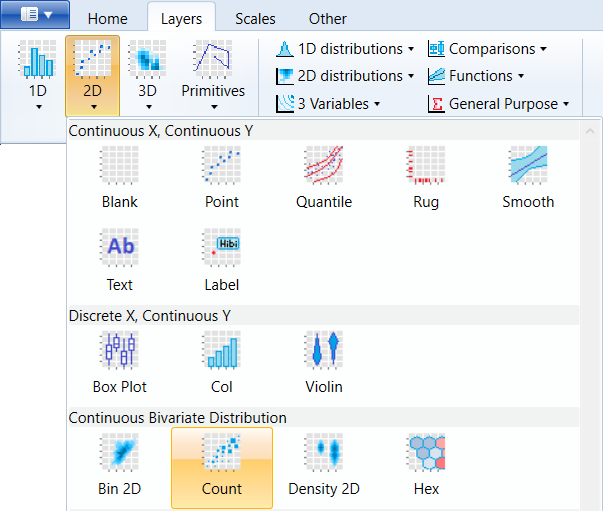
a positional aesthetic properties x and y. You can find this
geometry in the ribbon toolbar tab Layers, under the 2D button.
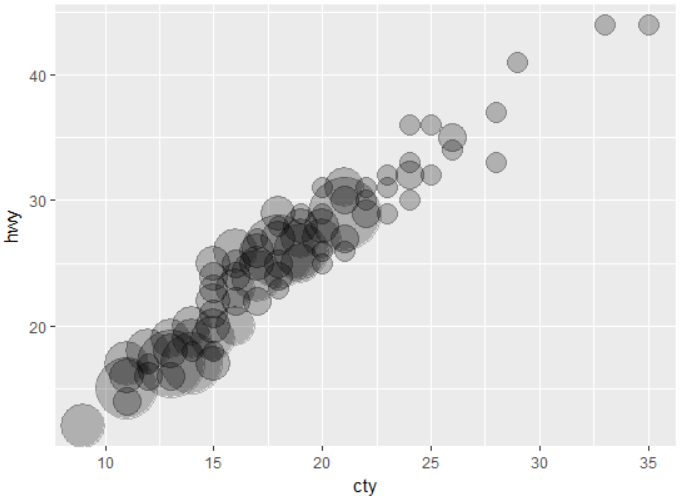
Another geometry layer with which we display continuous bivariate
distribution is geom_count. This is a special type of geom_point
layer. As in the case of point geometry, we define positional
aesthetic parameters x and y. The difference from the classic
point geometry is that it displays only unique points on the
given coordinates. The number of points with the same coordinates
is presented by the point size. The example shows the following
picture. As we can see, there are several points on the same
coordinate and therefore the point sizes increases with their
number.
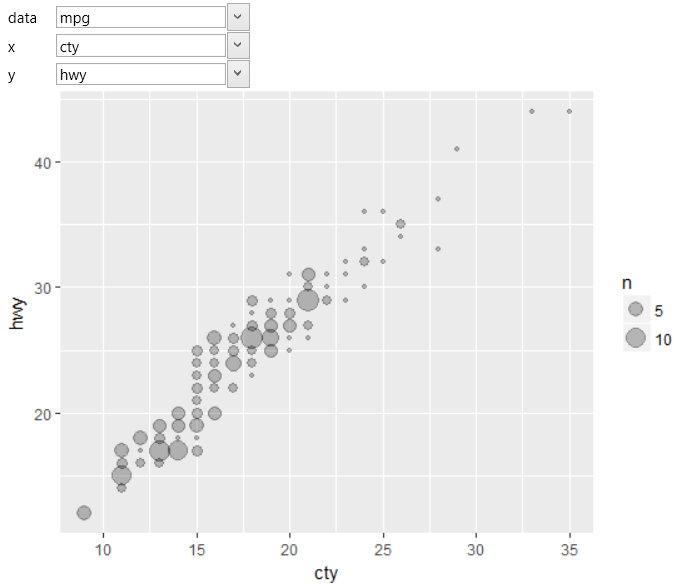
For the rendering, program uses a default size scale. If you want
to adjust it, use the scale_size_area object. An example of its
use is shown in the following plot. In this case, we have
increased the size scale.